Optimize the code with Linaro MAP
Describes how to profile and optimize the mmult example code using Linaro Performance Reports and Linaro MAP. Linaro Performance Reports can identify high memory accesses, and Linaro MAP can identify the time-consuming loops in the example code.
Prerequisites
You must install all the necessary tools as described in Software requirements.
You must complete the instructions in Compile and Run mmult, Fix the bug with Linaro DDT, and Analyze the behavior with Linaro Performance Reports
Ensure the code has been compiled with the
-gdebugging flag.
Procedure
To profile the code with multiple processes and the 3072x3072 test case, use
map --profile mpirun. For example:map --profile mpirun -n 8 ./mmult_c 3072
or
map --profile mpirun -n 8 ./mmult_f 3072
or
map --profile mpirun -n 8 python3 ./mmult.py -s 3072
If express launch is not supported for your MPI environment, run
map --profile:map --profile -n 8 ./mmult_c 3072
or
map --profile -n 8 python3 ./mmult.py -s 3072
The
--profileoption runs the profiler in non-interactive mode. When the execution terminates, a profile file (.map) is created by Linaro MAP:mmult_8p_1n_YYYY-MM-DD_HH-MM.map
YYYY-MM-DD_HH-MMcorresponds to a timestamp of the report creation date.To view the results, run the interactive mode:
map mmult_8p_1n_YYYY-MM-DD_HH-MM.map
Linaro MAP starts and displays the main profiler window. See MAP user interface.
Depending on your system configuration, the details might vary in your results. The profiler indicates that most of the time is spent in one line of the
mmultfunction (or when using the Python version, the corresponding calls in the C of F90 version):In C:
res += A[i*sz+k]*B[k*sz+j];
In F90:
res=A(k,i)*B(j,k)+res
Select this line of code. The CPU breakdown window appears on the right and shows the following results (Fig. 13):
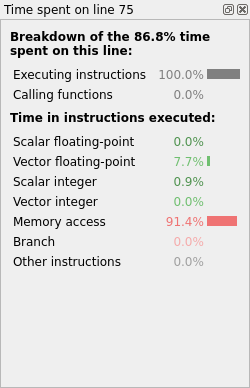
Fig. 13 Linaro MAP line breakdown without optimized memory accesses
The results indicate inefficient memory accesses. The loop nest performs strided accesses to array B. In addition to this, a dependency on intermediate results prevents the compiler vectorizing properly.
Note
On non-x86 architectures, the CPU breakdown is not available. To visualize the high amount of cycles per instructions, L2 (or L3) cache misses, and stalled back-end cycles when the
mmultfunction is being executed, instead use the CPU instructions metric graphs by selecting from the menu.In C, replace the following code:
for(int i=0; i<sz/nslices; i++)
{
    for(int j=0; j<sz; j++)
    {
        double res = 0.0;
        for(int k=0; k<sz; k++)
        {
            res += A[i*sz+k]*B[k*sz+j];
        }
        C[i*sz+j] += res;
    }
}
with:
for(int i=0; i<sz/nslices; i++)
{
    for(int k=0; k<sz; k++)
    {
        for(int j=0; j<sz; j++)
        {
            C[i*sz+j] += A[i*sz+k]*B[k*sz+j];
        }
    }
}
and in Fortran replace:
do i=0,sz/nslices-1
do j=0,sz-1
    res=0.0
    do k=0,sz-1
    res=A(k,i)*B(j,k)+res
    end do
    C(j,i)=res+C(j,i)
end do
end do
with:
do i=0,sz/nslices-1
do k=0,sz-1
do j=0,sz-1
    C(j,i)=A(k,i)*B(j,k)+C(j,i)
end do
end do
end do
Remove the previous executable, recompile, and run Linaro MAP again:
make -f mmult.makefile clean
make -f mmult.makefile
map --profile -n 8 ./mmult 3072
The profiling results show significant performance improvement because of the optimization (Fig. 14).
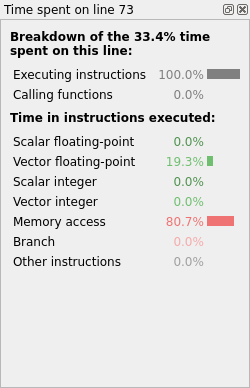
Fig. 14 Linaro MAP line breakdown with optimized memory accesses
Next Steps
To go further and use an optimized version of the matrix multiplication:
In the C version, call CBLAS instead of
mmult:#include <cblas.h> ... cblas_dgemm(CblasRowMajor, CblasNoTrans, CblasNoTrans, sz/nproc, sz, sz, 1.0, mat_a, sz, mat_b, sz, 1.0, mat_c, sz);In the F90 version, call BLAS instead of
mmult:call DGEMM('N','N', sz, sz/nproc, sz, 1.0D0, & mat_b, sz, & mat_a, sz, 1.0D0, & mat_c, sz)
Make sure you edit mmult.makefile to include the BLAS header and link to your
BLAS library, for instance with OpenBLAS:
CFLAGS = -Ofast -g -I/opt/openblas/include
LFLAGS = -L/opt/openblas/lib -lopenblas
In the Python version, the call to SciPy’s DGEMM can be run with the following command:
mpirun -n 8 python3 ./mmult.py -k Py -s 3072