Fix the bug with Linaro DDT
This topic describes how to identify and fix the bug in each of the examples/mmult*
source files with Linaro DDT.
Before you begin
You must install Linaro Forge as described in Software requirements.
You must complete the instructions in Compile and Run mmult.
Procedure
Recompile the application with the
-gdebugging flag.To make debugging simpler, Linaro recommends that you compile without using compiler optimizations. To disable optimizations, add the
-O0option to theCFLAGSvariable inmmult.makefile.CFLAGS = -O0 -g
Remove the initial executables with:
make -f mmult.makefile clean
And recompile with:
make -f mmult.makefile
Note
In Fortran, the compiler might display a warning. To display more information at runtime, compile using the
-fcheck=boundsflag with GCC, or-Mboundsusing the Arm® Compiler for Linux.Debug the application with ddt mpirun using express launch. For example:
ddt mpirun -n 8 ./mmult_c
ddt mpirun -n 8 ./mmult_f
ddt mpirun -n 8 python3 ./mmult.py
If your MPI environment does not support express launch (use
ddt --list-mpisto list the known MPIs and which are supported by express launch), run the ddt command:ddt -n 8 ./mmult_c ddt -n 8 ./mmult_f ddt -n 8 python3 ./mmult.py
Note
-n 8tells the debugger to debug using 8 processes. However, the application crashes at any scale.If you run the application on a remote system, see Connecting to a remote system for instructions.
Once Linaro DDT starts it will display the Run dialog (Fig. 8).
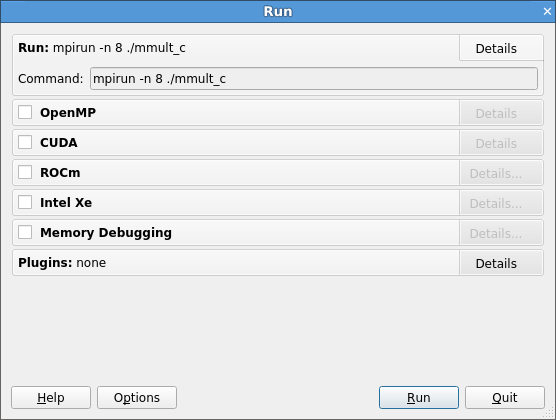
Fig. 8 Linaro DDT run dialog
To continue, click Run.
This displays the main debugger window. See DDT user interface.
Note
At this stage, the C and F90 versions display the source code of the application.
If Linaro DDT does not display the source code, recompile the source file and ensure that the
-gdebugging flag is included on the compile line. For complete instructions on how to compile the examples, see Compile and Run mmult.If you still experience a problem, contact Forge Support. For the Python version, no source code displays when the debugger attaches. This is expected when running in the Python interpreter. The C or F90 source code of the kernel displays when the application crashes, if you compile the kernels with
-g.To visualize where the application crashes, click Play (in the top-left corner):

The debugger stops where the application crashes (Fig. 9).
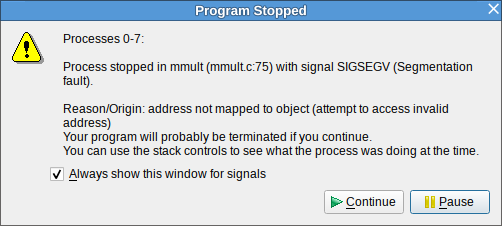
Fig. 9 Linaro DDT segmentation fault message
Click Pause.
The source code viewer highlights the line of code where the crash occurs. In C:
res += A[i*sz+k]*B[k*sz*j];
In F90:
res=A(k,i)*B(j,k+res)
This problem is caused by an error in the expression to compute the index of array B, and this results in an out of bound memory access. The bug can be fixed with:
In C:
res += A[i*sz+k]*B[k*sz+j];
In F90:
res=A(k,i)*B(j,k)+res
Note
To automatically detect an out of bound memory access with Linaro DDT, select the Memory debugging box in the Run window. Navigate to memory debugging Details and enable Add guard pages to detect out of bound heap accesses.
For more information, see Memory debugging.
Save the source file: select .
Recompile the source file: select .
By default, Build runs make in the current directory.
Note
To change the Build options, select and set the configuration settings.
To run the executable with the fix, select .
You are prompted to restart the application. Click Yes.
Play the application in the debugger again.
The application runs without any issues until every process in the program has terminated, and outputs the following when running 8 processes:
0: Size of the matrices: 64x64
3: Receiving matrices...
6: Receiving matrices...
2: Receiving matrices...
4: Receiving matrices...
7: Receiving matrices...
1: Receiving matrices...
5: Receiving matrices...
0: Initializing matrices...
0: Sending matrices...
1: Processing...
2: Processing...
3: Processing...
4: Processing...
5: Processing...
6: Processing...
7: Processing...
0: Processing...
1: Sending result matrix...
3: Sending result matrix...
5: Sending result matrix...
7: Sending result matrix...
2: Sending result matrix...
4: Sending result matrix...
6: Sending result matrix...
0: Receiving result matrix...
0: Writing results...
0: Done.
When fixed, the application writes the results in the working directory to a file called
res_C.mat,res_F90.mat, orres_Py.mat(depending on the version you used). Ensure that your working directory is writable.Note
To run Linaro DDT in non-interactive mode, use
ddt --offline ...:The debugger runs in the background of the application and outputs a debugging report. Open this report in your browser of choice:
firefox mmult_8p_1n_YYYY-MM-DD_HH-MM.html
YYYY-MM-DD_HH-MMcorresponds to a timestamp of the report creation date. For more information, see Offline debugging.