Analyze the behavior with Linaro Performance Reports
Describes how to analyze the behavior of the mmult example code, and how to check if there are any performance issues using Linaro Performance Reports.
Prerequisites
You must install all the necessary tools as described in Software requirements.
You must complete the instructions in Compile and Run mmult and Fix the bug with Linaro DDT.
Procedure
Run the application with eight processes on a large test case, for example 3072x3072 matrices:
perf-report mpirun -n 8 ./mmult_c 3072
or
perf-report mpirun -n 8 ./mmult_f 3072
or
perf-report mpirun -n 8 python3 ./mmult.py -s 3072
If your MPI environment does not support express launch, run the following command instead:
perf-report -n 8 ./mmult_c 3072
or
perf-report -n 8 python3 ./mmult.py -s 3072
When the execution terminates, Linaro Performance Reports creates two files:
mmult_8p_1n_YYYY-MM-DD_HH-MM.txtmmult_8p_1n_YYYY-MM-DD_HH-MM.html
YYYY-MM-DD_HH-MMcorresponds to a timestamp of the report creation date. The two files contain the same data, in two different formats.To visualize the results, open the HTML file in your web browser (either locally or remotely if you have X forwarding enabled). For example, to use Firefox:
firefox mmult_8p_1n_YYYY-MM-DD_HH-MM.html
Alternatively open the
.txtfile in any fixed-width code editor:vim mmult_8p_1n_YYYY-MM-DD_HH-MM.txt
The report (Fig. 10) shows different sections:
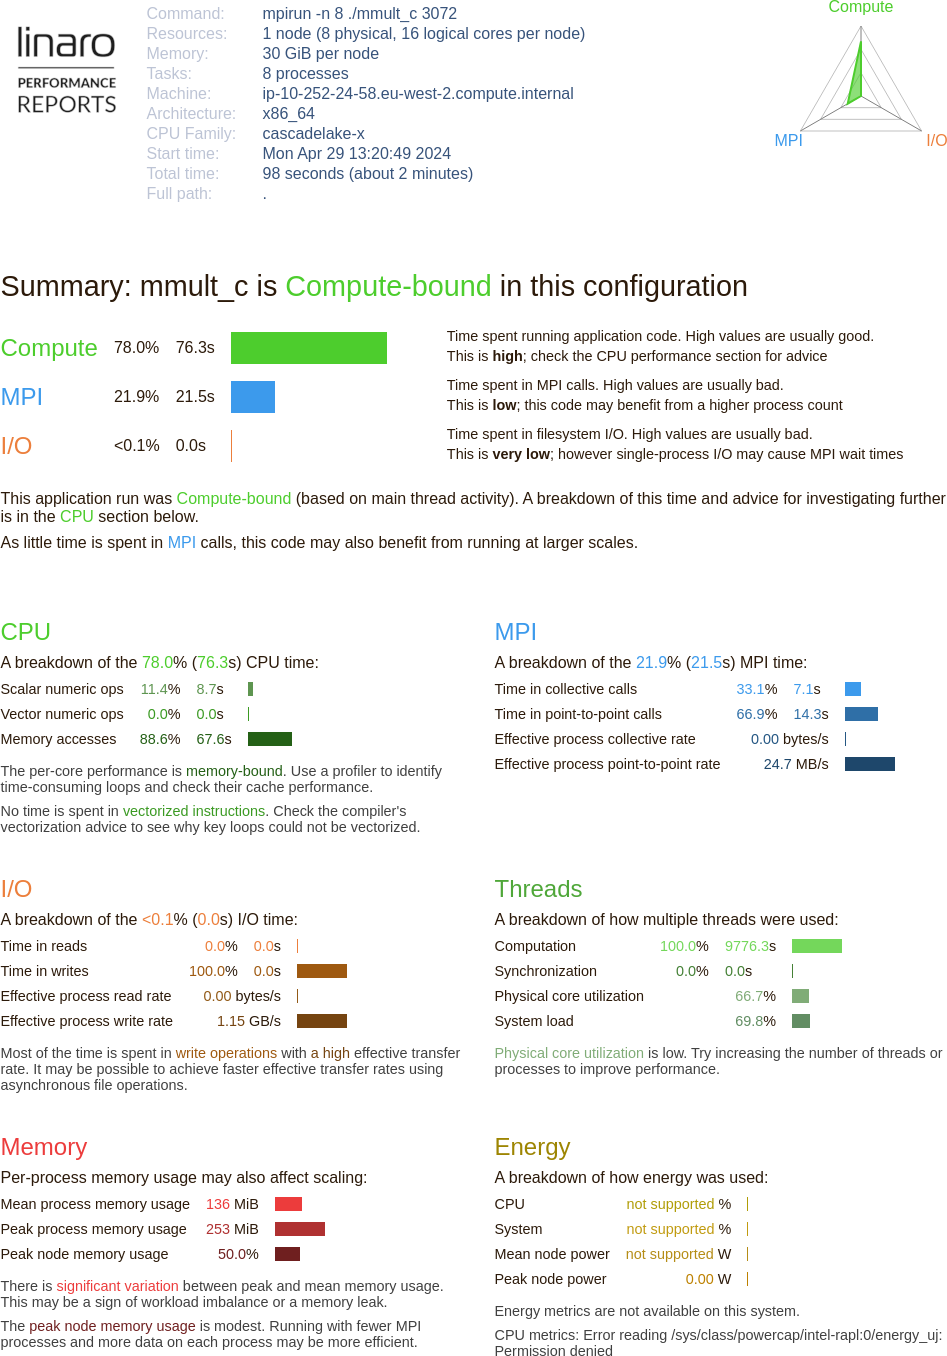
Fig. 10 Linaro Performance Reports HTML document
- Application Details (top)
Describes the system settings (including the number of physical and logical cores), the job configuration (including the number of processes and number of nodes) and the execution time.
- Summary (middle)
The Summary section shows the amount of time spent in computations (CPU), communications (MPI), and IO.
- Breakdown sections (bottom)
Shows a breakdown of:
The CPU Breakdown (
x86_64only), CPU Metrics (aarch64only), MPI, and IO time.How multiple threads were used.
How much memory was used.
The details of the report will be different and relevant to your system configuration, but the report should indicate that the application is CPU bound.
The CPU breakdown section (
x86_64only) gives more information about the type of instruction run (Fig. 11):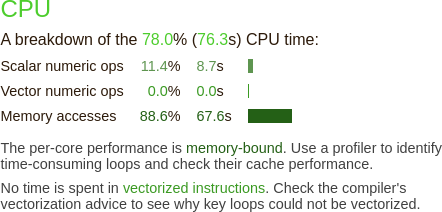
Fig. 11 Linaro Performance Reports CPU metrics without compiler optimizations
The compiler does not perform vectorization. As the report suggests, you can change the behavior by changing your compiler options.
Note
On non-x86 architectures, the CPU metrics are different. Instead, the tool reports the following metrics:
Cycles per instructions
Amount of L2 (or L3) cache accesses
Amount of processor back-end/front-end stalls
Keep these numbers low for better performance.
To enable the
-Ofastcompiler optimization (including vectorization), editmmult.makefile:CFLAGS = -Ofast -g
Remove the previous executable, recompile, and run Linaro Performance Reports again:
make -f mmult.makefile clean
make -f mmult.makefile
perf-report mpirun -n 8 ./mmult_c 3072
The new report shows a performance improvement because the code has been vectorized by the compiler (Fig. 12).
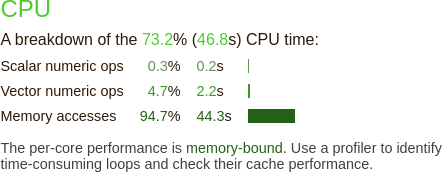
Fig. 12 Linaro Performance Reports CPU metrics with compiler optimizations
Tip
You should always profile binaries compiled using the same optimization flags you use
in production i.e. -O2 or -Ofast. For best results, use -g flag (or -g1
when you need to minimize the amount of debug information, such as when profiling the
-g compiled binary triggers out-of-memory errors).
See Prepare a program for profiling for more on recommended compilation flags for use with Linaro MAP and Linaro Performance Reports.