Use Selected lines view
To access the Selected lines view, open one of your program’s source files in the Source code viewer and highlight a line.
The Selected lines view is by default shown on the right side of the Source code viewer. It updates automatically to show a detailed breakdown of how the selected lines are spending their time.
You can select multiple lines, and Linaro MAP will show information for all of the lines together.
You can also select the first line of a collapsed region to see information for the entire code block. See View source code (MAP) for more information.
If you use the Metrics view to select a region of time, the Selected lines view only shows details for the highlighted region. See Metrics view for more information.
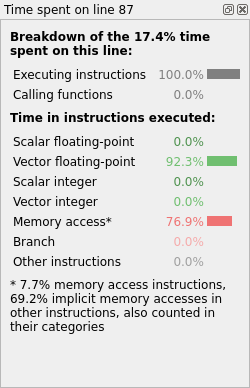
The Selected lines view is divided into two sections.
The first section gives an overview of how much time was spent executing instructions on this line, and how much time was spent in other functions.
If the time spent executing instructions is low, consider using the Stacks view, or the Functions view to locate functions that are using a lot of CPU time. For more information on the Stacks view see Stacks view. For more information on the Functions view see Functions view.
The second section details the CPU instruction metrics for the selected line.
These largely show the same information as the global program metrics, described in CPU instructions, but for the selected lines of source code.
Unlike the global program metrics, the line metrics are divided into
separate entries for scalar and vector operations, and report time spent
in implicit memory accesses.
On some architectures, computational instructions (such as integer or vector operations) are allowed to access memory implicitly. When these types of instruction are used, Linaro MAP cannot distinguish between time performing the operation and time accessing memory, and therefore reports time for the instruction in both the computational category and the memory category.
The amount of time spent in ‘explicit’ and ‘implicit’ memory accesses is reported as a footnote to the time spent executing instructions.
Some guidelines are listed here:
In general, aim for a large proportion of time in vector operations.
If you see a high proportion of time in scalar operations, try checking to see if your compiler is correctly optimizing for your processor’s SIMD instructions.
If you see a large amount of time in memory operations, look for ways to more efficiently access memory to improve cache performance.
If you see a large amount of time in branch operations, look for ways to avoid using conditional logic in your inner loops.
CPU instructions offers detailed advice on what to look for when optimizing the types of instruction your program is executing.