Time display mode
Time display toggle button
Use the Time display toggle button to switch between displaying time values in Linaro MAP as a percentage of profiled runtime, or total core-time.
Note
Core-time is estimated by multiplying the average sampling interval by the total number of samples representing any particular measurement across all threads and processes.
The accuracy of this estimate is dependent on the average sampling interval, which is proportional to the total profiling runtime, but with a lower bound dictated by the number of threads per process. In general, a higher profiling runtime leads to a higher average sampling interval. The average sampling interval of a profile is displayed in the status bar of Linaro MAP.
For more information on the average sampling interval in Linaro MAP, see
FORGE_SAMPLER_INTERVAL and FORGE_SAMPLER_INTERVAL_PER_THREAD.
It is important to keep in mind these limitations when comparing small-percentage differences in core-time between different Linaro MAP profiles. Differences in core-time may be negligible when considering the differences in average sampling intervals.
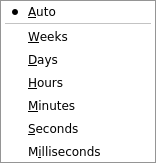
When displaying core-time, use the dropdown menu to switch units in which core-time is displayed. Linaro MAP chooses units to compactly display each value if is selected.