Compare MAP Profiles
Comparing MAP profiles can be a useful approach when optimizing an application. For example, when measuring the impact of different compilation flags or performance variances between compilers.
Comparing MAP profiles can also be useful when carrying out regression analysis. For example, comparing the impact of porting an application from one architecture to another, introducing accelerators to areas of the application, or identifying slow-downs in an application run-time from a previous build.
Linaro MAP can compare two profiles in the user interface by aligning the activity of two profiles at key Alignment Points (see Alignment Points) in the profile timeline. This can be achieved by:
Comparing two pre-existing Linaro MAP profiles (
.mapfiles).Comparing a pre-existing Linaro MAP profile (
.mapfile) with an application being profiled.
When comparing MAP profiles, one is defined as current and the other as baseline. The current profile will refer to:
the application being profiled
or, the
.mapfile being loaded.
The baseline will refer to the profile the current is being compared against.
For example, the current profile could refer to a profile generated on an aarch64 architecture. This profile could be compared against a baseline profile generated on an x86_64 architecture, if porting an application from x86_64 to aarch64, or vice versa.
Loading two profiles
Compare pre-existing profiles
To compare two pre-existing Linaro MAP files, the paths to these .map files must be provided to
Linaro MAP.
To load two profiles via the command-line use the --baseline option to provide the path to
the baseline profile. This will result in both profiles being opened in the GUI.
map --baseline=<baseline-profile> <current-profile>
To load two profiles via the Welcome Page (see Welcome page), select Compare Profile Data Files to open the Compare Profile Files Dialog.
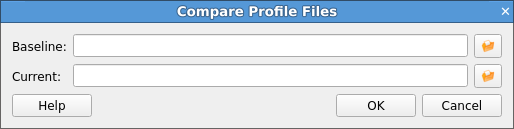
The file icon can be used to navigate to the location of the current and baseline profiles. When paths are provided, selecting OK will result in both profiles being opened in the GUI.
Note
The baseline and current profiles must have distinct filenames.
Profiling an application
To compare a pre-existing baseline profile with an application being profiled, provide the
path to the baseline profile via the command-line --baseline when launching Linaro MAP.
Select Profile on the Welcome Page (see Welcome page)
to launch the Run Dialog and provide the application arguments.
map --baseline=<baseline-profile>
Or, launch Linaro MAP with the baseline profile followed by your application launch arguments:
map --baseline=<baseline-profile> program-name [arguments]
In both instances, upon completion of the application being profiled, this current profile will be opened in the GUI with the baseline profile provided on the command-line.
Note
Comparing MAP files with --baseline cannot be used when generating an offline profile
with --profile.
User-Interface
When comparing a current and baseline profile, one profile will often be faster than the other. Linaro MAP will represent this difference in runtimes with shaded gaps at the end of the shorter profile in the Metrics View (see Metrics view).
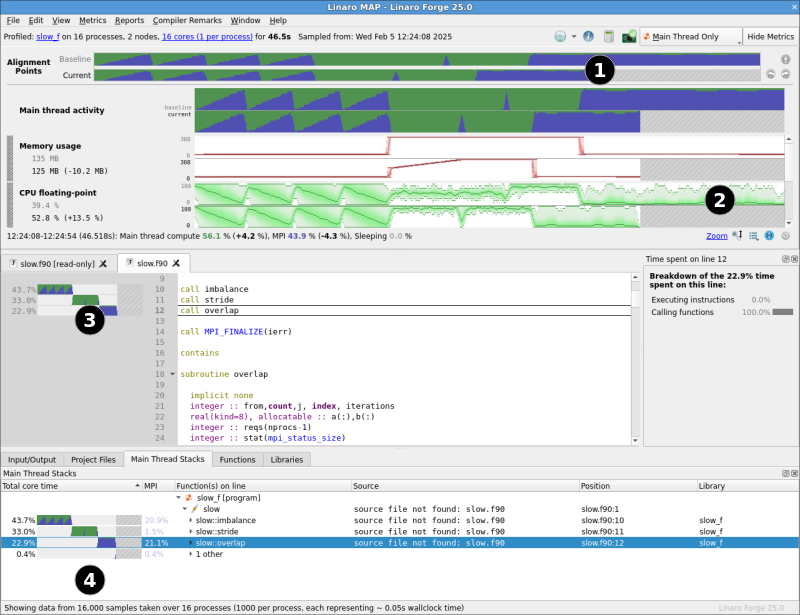
This table shows the Linaro MAP components currently displaying comparison information:
Key |
Component |
|---|---|
1 |
|
2 |
|
3 |
|
4 |
Note
Not all features in Linaro MAP support comparing profiles.
Alignment Points
The most notable feature to indicate that two .map files are being compared is the
presence of the Alignment Points view. Alignment Points are used for inserting gaps in the
Metrics’ graphs such that common events, such as the start of various phases of program execution,
can be lined up vertically, even when preceding events take longer in one of the profiles.

This view displays the Main thread activity graphs for the current and baseline profiles. The horizontal length of these graphs are scaled, indicated with a gap at the end of the shortest graph, to align the wall-clock times of these two profiles.
These graphs are available for connecting Alignment Points between the current and baseline profiles. These points are connected by a red line between two points on each graph. Alignment points may not overlap in the Alignment Points view.
The following is a list of actions applicable to the Alignment Points view, including their corresponding button in the view, if the button exists.
Left Click |
Add an Alignment Point to both current and baseline profiles. |
Drag |
Reposition an Alignment Point on the selected graph, creating a gap on Metrics’ graphs. |
Left Click and Drag |
Add an Alignment Point to both current and baseline graphs, then reposition. |
Right Click |
Delete Alignment Point under mouse cursor. |

|
Delete All Alignment Points. |

|
Undo Last Alignment Point Action (Add, Move, Delete, Delete All) |

|
Redo Last Alignment Point Action (Add, Move, Delete, Delete All) |
Note
It is not possible to select a time range or horizontal zoom using the Alignment Points view. To select a time range or horizontal zoom, use the metrics graphs beneath the Alignment Points view, see Zooming.
The tooltips for each graph in the Alignments Points view will provide the
Program Metadata for each profile. This will include
information about how each profile was generated. The corresponding .map file name for each
profile can be found in this tooltip.
Metrics View
When comparing two profiles, each graph in the Metrics view (see Metrics view) will display the baseline graph above the current graph.
The baseline and current graphs are distinguished by their different font colors on the Metrics view legend.
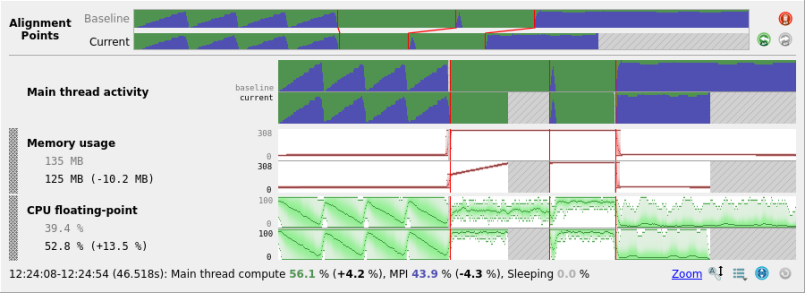
On Metrics graphs, the Alignment Points will always align vertically. However, there will be gaps inserted in the Metrics graphs to reflect variances between runtimes between Alignment Points. These Alignment Points are indicated by a red line in each current and baseline graph, preceded by a shaded gap created by aligning these samples between the profiles.
For example, the Sawtooth pattern at the start of each profile in the image above can be aligned by creating a minimal size gap on the baseline metrics graphs. The runtime of these common events are similar.
However, the large area of compute (green) with minimal MPI communication (blue) requires a large gap be added to the current profile to align the MPI communication spike in the middle of each profile.
In the Metrics view legend, the Selection Mean (see Selection Mean) for the baseline graph is shown above the selection mean for the current graph. These selection means are distinguished by their corresponding font colors. The difference between these two values is displayed to the right of the current graph selection mean. Hovering over the tooltips for each of these entries in the Metrics view will provide more details about notable differences between the profiles.
Due to the increased area attributed to each metric in the Metrics view when displaying both the baseline and current graphs, a scroll bar may appear for navigating the metrics view.
The height of each metric graph pair (current and baseline) can be modified, see Metrics Height. When this height is altered, it will persist in the user’s local settings between sessions. See Configuration files for more information about changing these settings.
[map metric graphs]
mapdiff graph height = 35
metrics table autoresize cap = 425
These settings can also be reset by selecting Window and Default Layout in the menu options.
Note
If a metric is available in one profile but is missing in another (for example, in the case of architecture or accelerator specific metrics), then an error message will be displayed in the corresponding graph detailing why this metric was not captured.
Source Code Viewer
Each line in the Source Code Viewer (see View source code (MAP)) will continue to display the project files for the current profile. These source lines will be annotated with performance information for the current profile but will also contain representation of gaps created by Alignment Points and gaps representing if the current profile is slower than the baseline profile.
Various Stacks Views
The following views also contain gaps displayed in the performance annotation for each line:
GPU Kernels Tab, see NVIDIA GPU Kernels and AMD GPU Kernels.
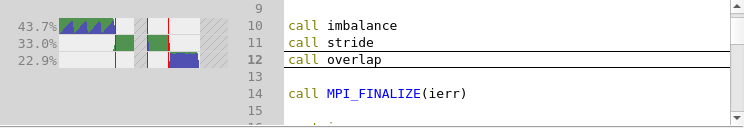
The line in the view will show performance annotation for the current profile, including gaps representing where the current profile is slower than the baseline profile and where the Alignment Points have introduced gaps between the profiles.
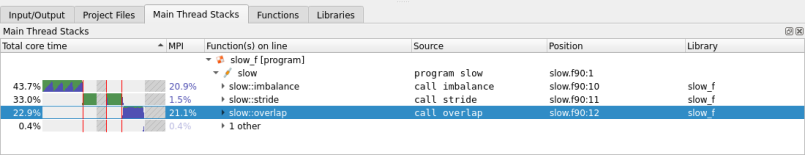
In the image above, we can see clearly where the Alignment Points have been placed to delineate the three major regions of the application.