DDT user interface
Linaro DDT uses a tabbed-document interface to display multiple documents. This means you can have many source files open. You can view one file in the full workspace area, or two if the Source Code viewer is ‘split’.
Each component of Linaro DDT is a dockable window that you can drag around by a handle, usually on the top or left edge. You can also double-click or drag a component outside of Linaro DDT, to form a new window. You can hide or show most of the components using the View menu. You can also select preset or custom metrics displays. The screenshot shows the default layout.
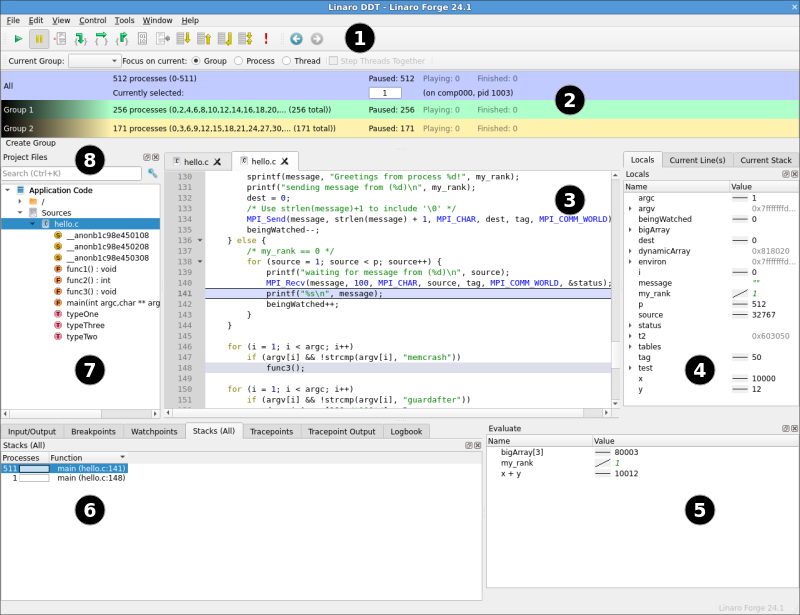
The table shows the main components:
Key |
Component |
|---|---|
1 |
|
2 |
|
3 |
|
4 |
|
5 |
|
6 |
Parallel Stack view, IO, Breakpoints, Watchpoints, Tracepoints, Tracepoint output, Logbook |
7 |
|
8 |
Note
On some platforms, the default screen size might be insufficient to display the status bar. If this occurs, expand the Linaro DDT window until it is completely visible.