Tracepoints
Tracepoints enable you to see what lines of code your program is executing, and the variables, without stopping the program. When a thread reaches a tracepoint it will print the file and line number of the tracepoint to the Tracepoint Output tab. You can also capture the value of any number of variables or expressions at that point.
Tracepoints can be particularly useful in these situations, for example:
Recording entry values in a function that is called many times, but crashes only occasionally. If you set a tracepoint it is easier to correlate the circumstances that cause a crash.
Recording entry to multiple functions in a library, enabling the user or library developer to check which functions are being called, and in which order. An example of this is the MPI History Plugin, which records MPI usage. See Use a plugin.
Observing progress of a program and variation of values across processes without having to interrupt the program.
Set tracepoints
To add a tracepoint:
Right-click on a line in the Source Code viewer and select Add Tracepoint.
Right-click in the Tracepoints tab and select Add Tracepoint.
When you right-click in the Source Code viewer a number of variables based on the current line of code are captured by default.
Tracepoints can lead to considerable resource consumption if they are placed in locations likely to generate a lot of passing. For example, if a tracepoint is placed inside a loop with N iterations, then N separate tracepoint passes will be recorded.
There is an attempt to merge such data in a scalable manner, but when alike tracepoints are passed in order between processes, where process behavior is likely to be divergent and unmergeable, then a considerable load would result.
If it is necessary to place a tracepoint inside a loop, set a condition on the tracepoint to ensure you only log what is of use to you. Conditions may be any valid expression in the language of the file the tracepoint is placed in and may include function calls, although you may want to be careful to avoid functions with side effects as these will be evaluated every time the tracepoint is reached.
Tracepoints also momentarily stop processes at the tracepoint location to evaluate the expressions and record their values. This means if they are placed inside (for example) a loop with a very large number of iterations, or a function executed many times per second, then you will see a slowdown in your program.
Tracepoint output
The output from tracepoints can be viewed on the Tracepoint Output tab.
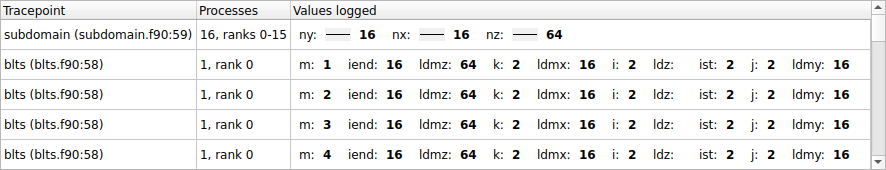
Where tracepoints are passed by multiple processes within a short interval, the outputs will be merged. Sparklines of the values recorded are shown for numeric values, along with the range of values obtained, showing the variation across processes.
As alike tracepoints are merged, this can lose the order/causality between different processes in tracepoint output. For example, if process 0 passes a tracepoint at time T, and process 1 passes the tracepoint at T + 0.001, this will be shown as one passing of both process 0 and process 1, with no ordering inferred.
Sequential consistency is preserved during merging, so for any process, the sequence of tracepoints for that process will be in order.
To find particular values or interesting patterns, use Only show
lines containing at the bottom of the panel. Tracepoint lines
matching the text entered here will be shown, the rest will be hidden.
When searching for a particular value, for example my_var: 34,
the space at the end helps distinguish between my_var: 34 and my_var: 345.
For more detailed analysis, export the tracepoints by right-clicking and choosing Export. An HTML tracepoint log will be written using the same format as in offline mode.