Usage
The Logbook tab is located at the bottom of the main window.
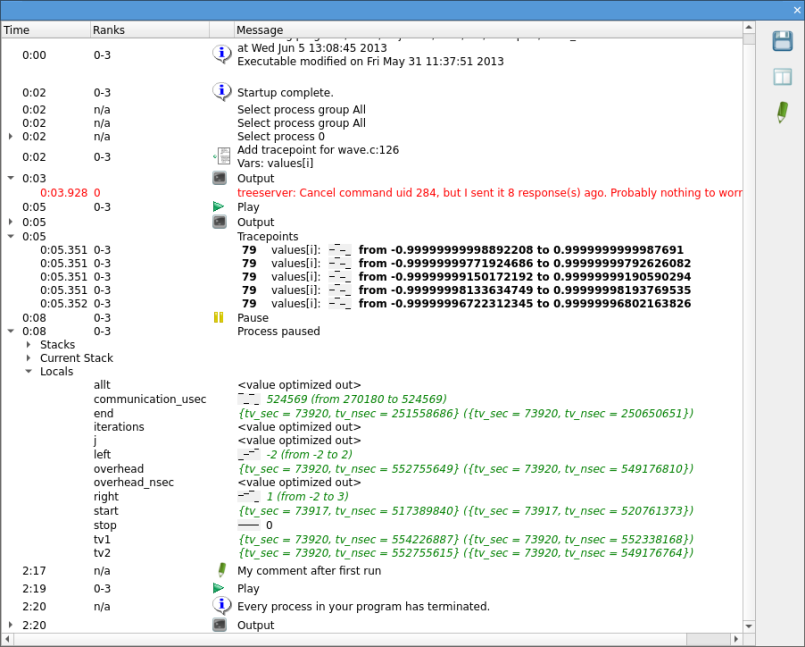
The Logbook automatically generates a log of all of your actions. It does not require any additional configuration.
For example, if you add a breakpoint or a tracepoint, or play the program, these actions are logged. For each stop of the program, the reason and location is recorded together with the parallel stacks and local variables for one process.
You can export the current logbook as HTML, or compare it to a previously exported one.
To export the logbook, click the disk icon on the right side of the Logbook tab and specify a filename.
You can open previously saved logbooks from the Tools menu.
This enables comparative debugging and repeatability. It is always clear how a certain situation in the debugger was caused as the previous steps are visible.