Memory Statistics
The Memory Statistics window () shows a total of memory usage across the processes in a program. The processes using the most memory are displayed, along with the mean across all processes in the current group, which is useful for larger process counts.
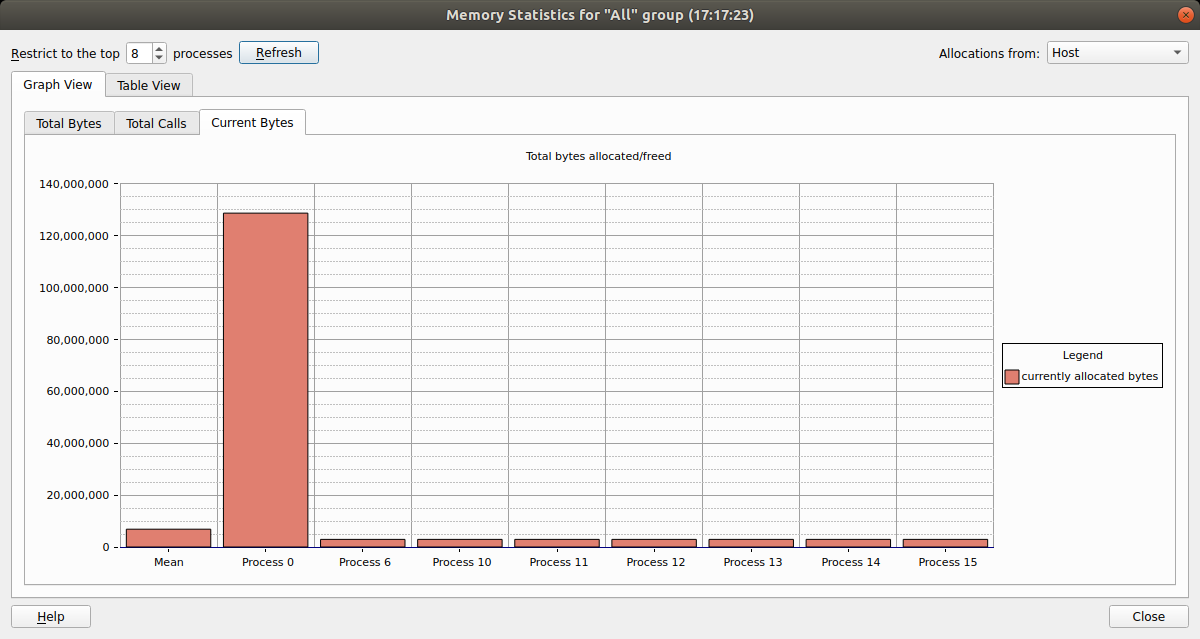
The contents and location of the memory allocations themselves are not repeated here. Instead this window displays the total amount of memory allocated and freed since the program began, the current number of allocated bytes, and the number of calls to allocation and free routines.
These can help show if your program is unbalanced, if particular processes are allocating or failing to free memory, and so on. At the end of program execution you can usually expect the total number of calls per process to be similar (depending on how your program divides up work), and memory allocation calls should always be greater than deallocation calls. Anything else indicates serious problems.
If your application is using high bandwidth memory, the charts and tables in this window will be broken down into each type of memory in use.