Memory debugging options
Manual configuration is often unnecessary, but it can be used to adjust the memory checks and protection, or to alter the information which is gathered.
The current settings are displayed in the Memory Debugging section on the Run dialog.
To examine or change the settings, click Details adjacent to the Memory Debugging checkbox. The Memory Debugging Options window displays.
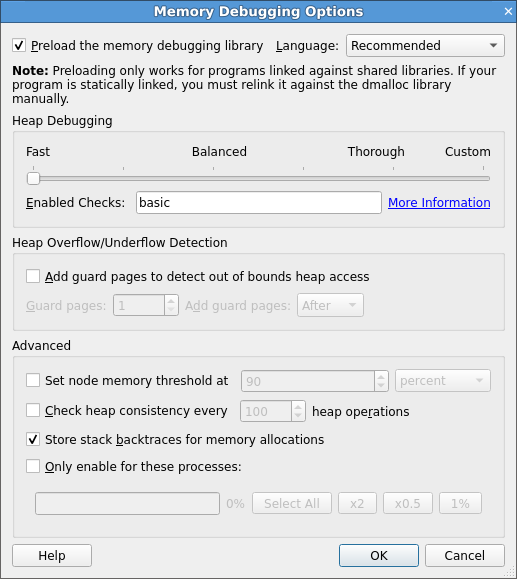
The available settings are:
- Preload the memory debugging library:
When this is selected, the memory debugging library will be automatically loaded. The memory debugging library can only preload when you start a program. It uses shared libraries.
Preloading is not possible with statically-linked programs, or when attaching to a running process. See the Static linking section for more information.
When attaching, you will need to change these settings after you attach. See the Change settings at run time section below for more information.
- Language:
Choose the option that best matches your program, for example C, Fortran, No threads, threads. If it mixed language, or you are unsure which option to use, it is often sufficient to leave this set to Recommended rather than continually changing this value.
- Heap Debugging:
This section allows you to trade speed for thoroughness. Some important things to remember are:
Even the fastest (furthest left) setting will catch trivial memory errors such as deallocating memory twice.
The further right you go, the more slowly your program will execute. In practice, the Balanced setting is still fast enough to use and will catch almost all errors. If you come across a memory error that is difficult to pin down, choosing Thorough might expose the problem earlier, but you will need to be very patient for large, memory intensive programs. See also the Change settings at run time section.
- Enabled Checks:
Shows which checks are enabled for each setting. See the Available checks section for a complete list of available checks.
- Heap Overflow/Underflow Detection:
This section can be used to detect out-of-bounds heap access. See Writing beyond an allocated area on Pointer error detection and validity checking for more details.
- Set node memory threshold:
Can be used to detect potential out of memory errors early. See Node memory threshold detection for more details.
- Check heap consistency:
Almost all users can leave the heap check interval at the default value. It determines how often the memory debugging library will check the entire heap for consistency. This is a slow operation, so it is normally performed every 100 memory allocations. We recommend a higher value (1000 or above) if your program allocates and deallocates memory very frequently, for example, inside a computation loop.
- Store stack backtraces for memory allocations:
If your program runs particularly slowly with memory debugging enabled, you might be able to get a modest speed increase by clearing this checkbox. This disables stack backtraces in the View Pointer Details and Current Memory Usage windows, support for custom allocators, and cumulative allocation totals.
- Only enable for these processes:
When this is selected, you can enable memory debugging only for the specified MPI ranks. Note that when you enable this feature, the memory debugging library is still preloaded into the other processes, but no errors are reported. Furthermore, backtraces for memory allocation are not stored and guard pages are not added for the other processes.
Note
If you choose the wrong library to preload, or the wrong number of bits, your job might not start, or might make memory debugging unreliable. You should check these settings if you experience problems when memory debugging is enabled.
Static linking
If your program is statically linked you must explicitly link the memory debugging library with your program to use the memory debugging feature.
To link with the memory debugging library, you must add the appropriate flags from the table below at the very beginning of the link command. This ensures that all instances of allocators, in both user code and libraries, are wrapped. Any definition of a memory allocator preceding the memory debugging link flags can cause partial wrapping, and unexpected runtime errors.
Note
If in doubt use libdmallocthcxx.a.
Multi-thread |
C++ |
Bits |
Linker Flags |
|---|---|---|---|
no |
no |
64 |
|
yes |
no |
64 |
|
no |
yes |
64 |
|
yes |
yes |
64 |
|
Where
--undefined=mallochas the side effect of pulling in all libc-style allocator symbols from the library.--undefinedworks on a per-object-file level, rather than a per-symbol level, and the c++ and c allocator symbols are in different object files within the library archive. Therefore, you may also need to specify a c++ style allocator such as_ZdaPvbelow.--undefined=_ZdaPvhas the side effect of pulling in all c++ style allocator symbols. It is the c++ mangled name of operator delete[].
To link the correct library, use the full path to the static library. This is more reliable than using the -l argument of a compiler.
See Intel compilers or NVIDIA HPC SDK compilers for compiler-specific information.
Available checks
The following heap checks are available in Enable Checks:
Name |
Description |
|---|---|
|
Detect invalid pointers passed to memory functions (such as |
|
Check the arguments of addition functions (mostly string operations) for invalid pointers. |
|
Check for heap corruption, for example, due to writes to invalid memory addresses. |
|
Check the end of an allocation has not been overwritten when it is freed. |
|
Initialize the bytes of new allocations with the known value of |
|
Overwrite the bytes of freed memory with the known value of the |
|
Check to see if blanked space has been overwritten. Space is blanked when it either
has a pointer allocated to it, or the pointer has been freed. This enables
|
|
Always copy data to a new pointer when reallocating a memory allocation (for example,
due to |
|
Protect freed memory where possible (using hardware memory protection) so subsequent read/writes cause a fatal error. |
Change settings at run time
You can change most memory debugging settings while your program is running by selecting . This means you can enable memory debugging with a minimal set of options when your program starts, set a breakpoint at a place you want to investigate for memory errors, then switch on more settings when the breakpoint is hit.