Browse source code
Source code is automatically displayed when a process is stopped, when you select a process, or position in the stack changed. If the source file cannot be found you are prompted for its location.
Lines of the source code are highlighted to show the current location of your program’s execution. Lines that contain processes from the current group are shaded in that group’s color. Lines only containing processes from other groups are shaded in gray.
This pattern is repeated in the focus on process and thread modes. For example, when you focus on a process, lines containing that process are highlighted in the group color, while other processes from that group are highlighted in gray.
Lines of code that are on the stack are also highlighted, functions that your program will return to when it has finished executing the current one. These are drawn with a faded look to distinguish them from the currently-executing lines.
You can hover the mouse over any highlighted line to see which processes/threads are currently on that line. This information is presented in a variety of ways, depending on the current focus setting:
- Focus on Group
A list of groups that are on the selected line, along with the processes in them on this line, and a list of threads from the current process on the selected line.
- Focus on Process
A list of the processes from the current group that are on this line, along with the threads from the current process on the selected line.
- Focus on Thread
A list of threads from the current process on the selected line.
The tooltip distinguishes between processes and threads that are currently executing that line, and ones that are on the stack by grouping them under the headings On the stack and On this line.
- Variables and Functions
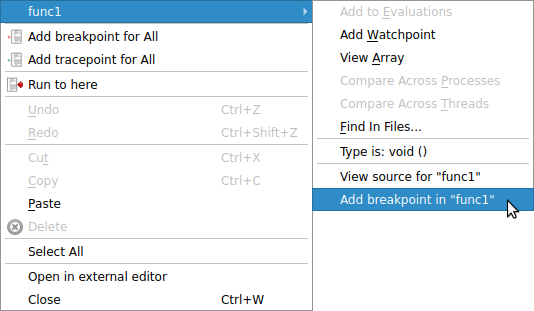
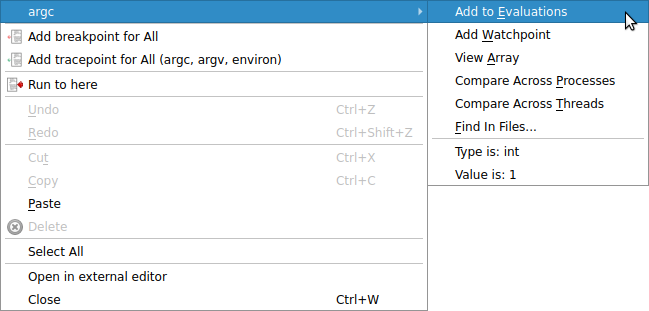
Right-click on a variable or function name in the Source Code viewer to check whether there is a matching variable or function, and then to display extra information and options in a sub-menu.
In the case of a variable, the type and value are displayed, along with options to view the variable in the Cross-Process Comparison View (CPC) or the Multi-Dimensional Array Viewer (MDA), or to drop the variable into the Evaluate window, each of which are described in the next section.
In the case of a function, it is also possible to add a breakpoint in the function, or to the source code of the function when available.