Assembly debugging
You can view disassembly, step over instructions, step into instructions, and set breakpoints on instructions in the Disassembly viewer when you are in assembly debugging mode.
Enable assembly debugging
To enable assembly debugging mode click the 0101 button in the toolbar.

When you enable assembly debugging mode the Disassembly viewer opens where you can view the disassembly of the current symbol that contains the program counter and changes the behavior of the step buttons to operate on the instruction level.
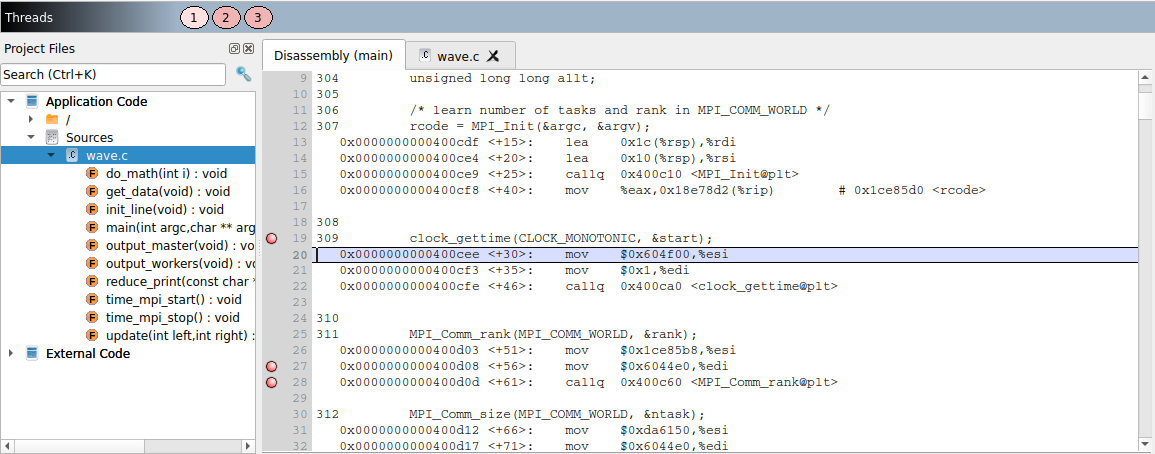
The Disassembly viewer auto updates the disassembly when the current symbol that contains the program counter changes.
When assembly debugging mode is disabled, the Disassembly viewer closes and reverts the behavior of the step buttons back to stepping source lines.
Breakpoints
The Disassembly viewer enables you to set breakpoints on instructions and also on source lines.
Every breakpoint is listed on the Breakpoints tab towards the bottom of the window and can be further edited from the Breakpoints tab. See Set breakpoints.