Profile a Python script
This task describes how to profile a Python script. This feature is useful when profiling a mixed C, C++, Fortran, and Python program.
About this task
Python profiling replaces main thread stack frames originating from the
Python interpreter with Python stack frames of the profiled Python
script. To disable this feature, set ALLINEA_SAMPLER_DISABLE_PYTHON_PROFILING=1.
Arm® MAP supports Python profiling with the following features:
- Profiles Python scripts running under the CPython interpreter (versions 2.7, and 3.5-3.10).
- Profiles Python scripts running under the Intel Distribution for Python.
- Profiles Python scripts running under the Anaconda Python distribution (version 3.6 not supported).
- Profiles Python scripts running under virtual environments.
- Profiles Python scripts that import modules which perform MPI on the main thread, such as mpi4py.
- Profiles Python scripts that import modules which use OpenMP.
- Profiles Python scripts that use the
threadingmodule.
Note
Arm® MAP will output warnings if the threading model of the MPI module is MPI_THREAD_MULTIPLE, such as in mpi4py. To prevent these warnings, change the default settings in mpi4py with the following: mpi4py.rc.threaded = False or mpi4py.rc.thread_level = "funneled".
Note
If you are profiling on a system using ALPS or SLURM and the Python script does not use MPI, you can set environment variables (Starting a program) or you can import the mpi4py module.
Procedure
Check that the Python script runs successfully:
$ python myscript.py
To profile the Python script with Arm® MAP, prepend the run command with
map:$ map python myscript.py
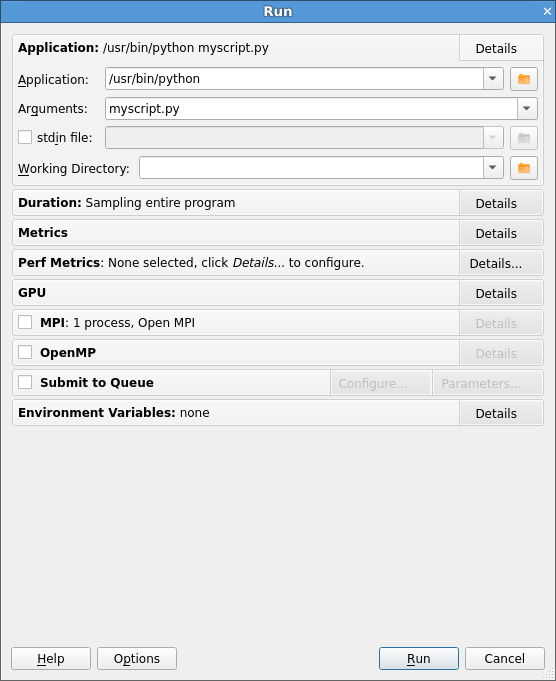
Click Run and wait for Arm® MAP to finish profiling the Python script.
View the profiling results in Arm® MAP.

Results
When Arm® MAP finishes profiling the Python script, it saves a .map file in
the current working directory and opens it for viewing in the user interface
(unless you are using the offline feature).
Example: Profiling a simple Python script
This section demonstrates how to profile the Python example script
python-profiling.py located in the examples directory.
Change into the
examplesdirectory and run the makefile to compile the example.$ make -f python-profiling.makefile
Start Arm® MAP.
$ ../bin/map python ./python-profiling.py --index 35
Click Run.
Wait for Arm® MAP to finish analyzing samples after the Python script has completed.
Note
The Arm® MAP user interface launches showing the Python script and the line in the script where the most time was spent is selected.
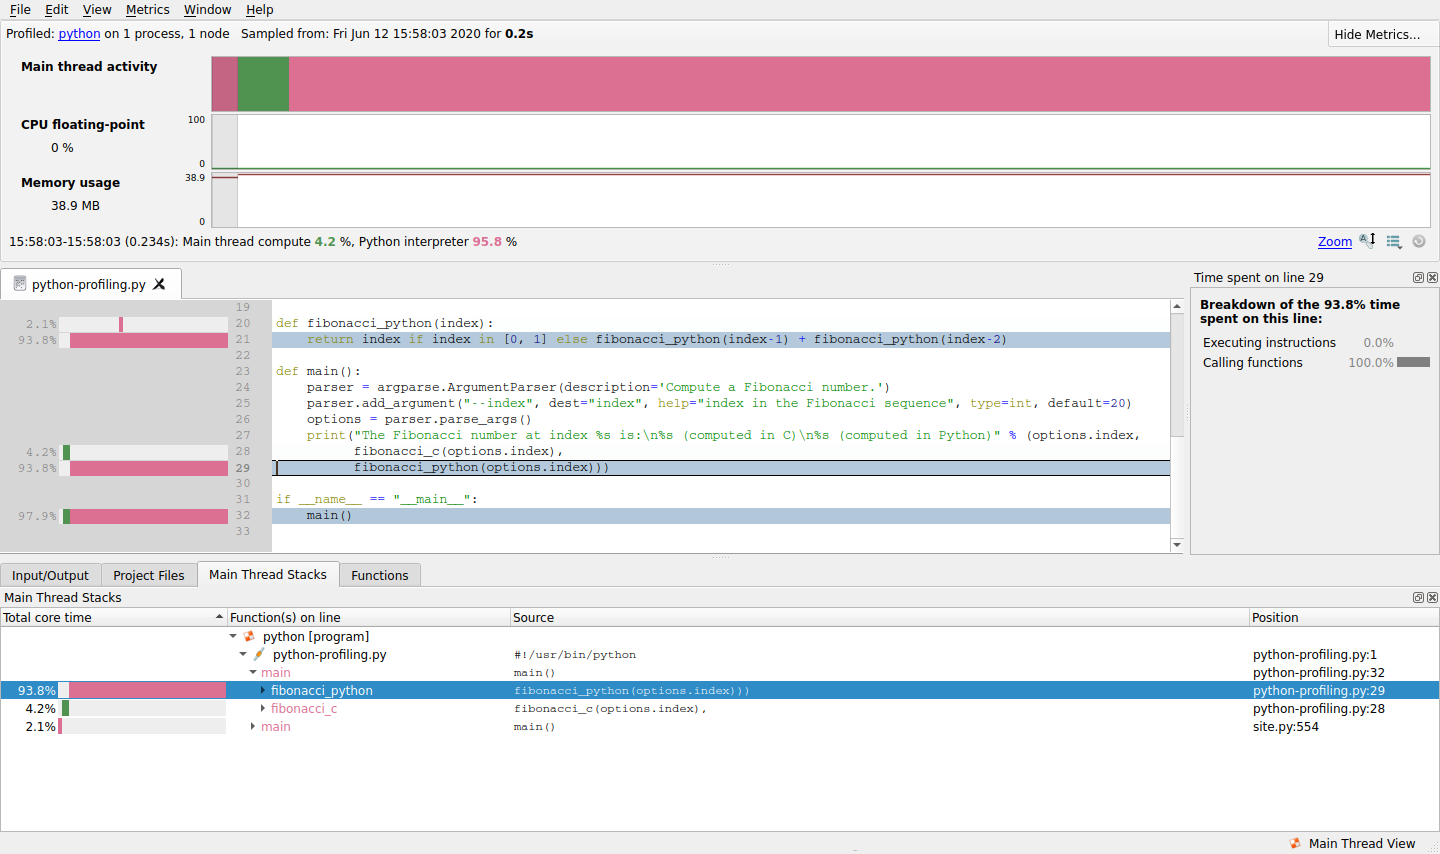
Locate the first
fibonacci_cstack frame in the Main Thread Stacks view. The callout to the C function is appended undermainPython stack frame.
Next steps
- Examine the Main Thread Activity graph (Metrics view) for an overview of time spent in Python code compared with non-Python code.
- View source code lines (View source code (MAP)) on which time was spent executing Python code and non-Python code.
- Compare time spent on the selected line executing Python code with non-Python code in the Selected lines view (Selected lines view).
- View a breakdown of time spent in different code paths in the Main Thread Stacks view (Stacks view).