Pointer error detection and validity checking
When you have enabled memory debugging and started debugging, all calls to the allocation and deallocation routines of heap memory will be intercepted and monitored. This allows for automatic monitoring for errors, and for user-driven inspection of pointers.
Library usage errors
If the memory debugging library reports an error, an error message will display. This briefly reports the type of error detected, and gives the options to continue playing the program, or to pause execution.
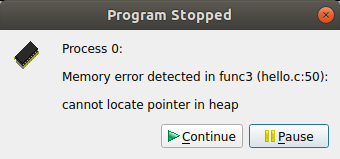
If you choose to pause the program, the line of your code that was being executed when the error was reported will be highlighted.
Often this is enough to debug simple memory errors, such as freeing or dereferencing an unallocated variable, iterating past the end of an array and so on, as the local variables and variables on the current line will provide insight into what is happening.
If the cause of the issue is still not clear, it is possible to examine some of the pointers referenced to see whether they are valid, and which line they were allocated on. This is explained in the following sections.
View pointer details
When memory debugging is enabled, right-click on any of the variables or expressions in the Evaluate window and choose View Pointer Details. This will display the amount of memory allocated to the pointer, and which part of your code originally allocated and deallocated that memory:
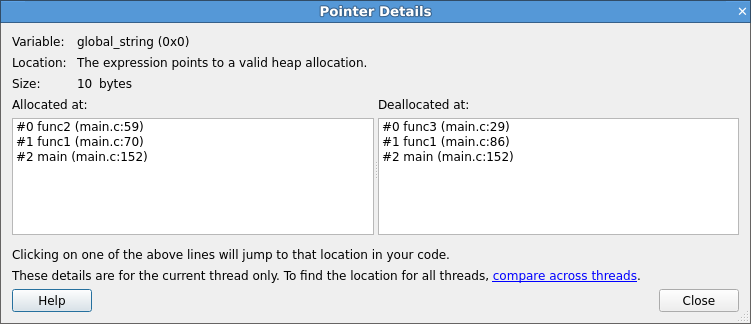
Click on any of the stack frames to display the relevant section of your code, so that you can see where the variable was allocated or deallocated.
Note
Only a single stack frame will be displayed if Store stack backtraces for memory allocations in the Memory Debugging Options window is disabled.
This feature can also be used to check the validity of heap-allocated memory.
Note
Memory allocated on the heap refers to memory allocated by malloc, ALLOCATE, new and so on.
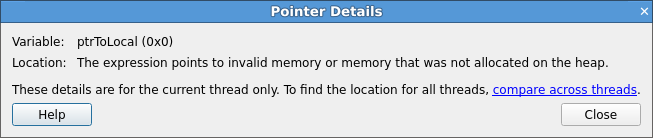
A pointer may also point to a local variable, in which case a message will inform you it does not point
to data on the heap. This can be useful, since a common error is taking a pointer to a local variable
that later goes out of scope.
This is particularly useful for checking function arguments, and key variables when things seem to be going wrong. Of course, just because memory is valid does not mean it is the same type as you were expecting, or of the same size and dimensions, and so on.
Memory Type/Location
As well as invalid addresses, you can often get an indication of the type and location of the memory being pointed to. The different types are:
Null pointer.
Valid heap allocation.
Fence-post area before the beginning of an allocation.
Fence-post area beyond the end of an allocation.
Freed heap allocation.
Fence-post area before the beginning of a freed allocation.
Fence-post area beyond the end a freed allocation.
A valid GPU heap allocation.
An address on the stack.
The program’s code section (or a shared library).
The program’s data section (or a shared library).
The program’s
bsssection or Fortran COMMON block (or a shared library).The program’s executable (or a shared library).
A memory mapped file.
High bandwidth memory.
Note
It may only be possible to identify certain memory types with higher levels of memory debugging enabled. See Memory debugging options for more information.
For more information on fence post checking, see the Fencepost checking section.
Cross-process comparison of pointers
Memory debugging has an impact on the Cross-Process Comparison View and Cross-Thread Comparison View. See Cross-process and cross-thread comparison.
If you are evaluating a pointer variable, the Cross-Process Comparison View shows a column with the location of the pointer.
Pointers to locations in heap memory are highlighted in green. Dangling pointers, that is pointers to locations in heap memory that have been deallocated, are shown in red.
The cross-process comparison of pointers helps you to identify:
Processes with different addresses for the same pointer.
The location of a pointer (heap, stack,
.bss,.data,.textor other locations).Processes that have freed a pointer while other processes have not, null pointers, and so on.
If the cross-process comparison shows the value of what is being pointed at when the value of
the pointer itself is wanted, then modify the pointer expression. For example, if you see the
string that a \char* pointer is pointing at when you actually want information concerning
the pointer itself, then add (void *) to the beginning of the pointer expression.
Writing beyond an allocated area
Use the Heap Overflow/Underflow Detection section on the Memory Debugging Options window to detect reads and writes beyond or before an allocated block. Any attempts to read or write to the specified number of pages before or after the block will cause a segmentation violation that stops your program.
Add the guard pages after the block to detect heap overflows, or before to detect heap underflows. The default value of one page will catch most heap overflow errors, but if this does not work a good rule of thumb is to set the number of guard pages according to the size of a row in your largest array.
The exact size of a memory page depends on your operating system, but a typical size
is 4 kilobytes. In this case, if a row of your largest array is 64 KiB, then set the
number of pages to  .
.
Note
Small overflows/underflows (for example less than 16 bytes) might not be detected. This is a result of maintaining correct memory alignment, and without this vectorized code may crash or generate false positives.
To detect small overflows or underflows, enable fencepost checking. See the Fencepost checking section.
Note
Your program will not be stopped at the exact location at which your program wrote beyond the allocated data, it only stops at the next heap consistency check.
On systems with larger page sizes (for example 2MB, 1GB) guard pages should be
disabled or used with care as at least two pages will be used per
allocation. On most systems you can check the page size with getconf PAGESIZE.
Fencepost checking
‘Fence Post’ checking will also be performed when the Heap Debugging section on the Memory Debugging Options window is not set to Fast.
In this mode, an extra portion of memory is allocated at the start and/or end of your allocated block, and a pattern is written into this area.
If your program attempts to write beyond your data, say by a few elements, this will be noticeable. However, your program will not be stopped at the exact location that your program wrote beyond the allocated data, it will only be stopped at the next heap consistency check.
Suppress an error
If your program stops at an error, but you wish to ignore it (for example, if it is in a third party library that you cannot fix), you can select Suppress memory errors from this line in future. This will open the Suppress Memory Errors window, where you can select which function you want to suppress errors from.