Analyze your program
Use Linaro MAP with the Arm Statistical Profiling Extension (SPE) to find locations in your code where particular hardware events are most commonly triggered.
Profile your program using Linaro MAP with Arm SPE profiling enabled. Use the filter you are interested in (cache events, tlb walk events, or branch mispredict events).
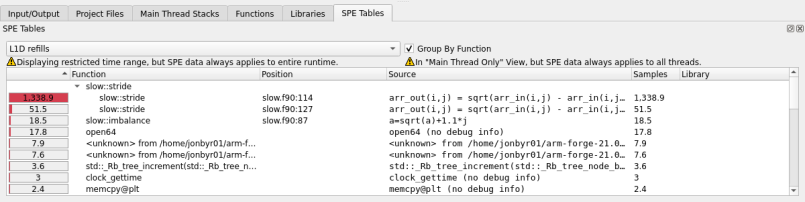
Switch to the SPE Tables tab at the bottom of the screen to view the average number of hardware events sampled per process by the SPE feature, by source code line.
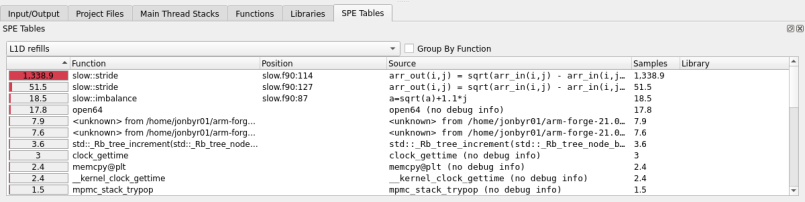
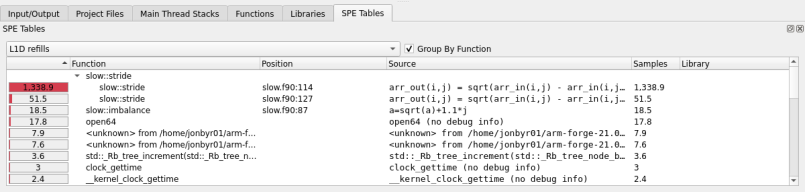
Optionally, toggle between a plain list of lines containing events, and group the rows by function.
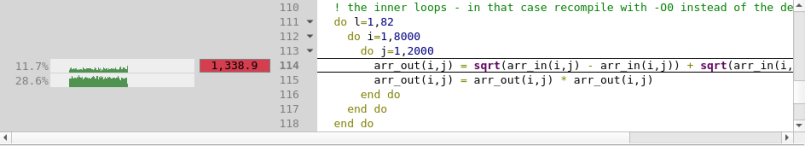
Click a row to jump to that location in the source code editor. The average number of SPE samples per process on each line is also displayed here.
If the cache event filter is used, two tables are generated. One table is for all level 1 data cache refill events, and the other is for those for that caused a cache miss in the last level of cache.
Switch between these tables using the menu at the top of the SPE Tables tab. This also updates the count of SPE samples that the code editor displays.
Alternatively, identify bottlenecks using the regular Linaro MAP stacks tabs, and check the surrounding lines in the code editor for SPE samples to draw conclusions about the cause of the bottleneck.
You can profile your application several times using the different SPE filters to collect information on the various types of event.
Note
For performance reasons, Linaro MAP aggregates SPE samples over the lifetime of the program being profiled, and merges samples taken from all threads. Because it is not possible to correctly display which SPE samples apply to a selected time range, the SPE samples display in the Source code editor is hidden when a time range is selected. When this occurs, a dialog box displays that you can dismiss.
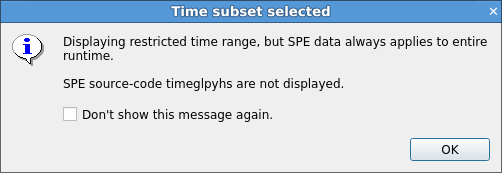
The SPE Tables tab also displays a warning in this case. When you view the Main Thread Only view mode, another warning displays because some of the SPE samples that are listed might have come from one of the non-main threads not normally included in this view.