OpenMP programs
For an OpenMP or multi-threaded program (or a mixed-mode MPI+OpenMP program) you will also see other colors used.
Light green Multi-threaded computation time. For an OpenMP program this is time inside OpenMP regions. When profiling an OpenMP program you want to see as much light green as possible, because that is the only time you are using all available cores. Time spent in dark green is a potential bottleneck because it is serial code outside an OpenMP region.
Light blue Multi-threaded MPI communication time. This is MPI time spent waiting for MPI communication while inside an OpenMP region or on a pthread. As with the normal blue MPI time you will want to minimize this, but also maximize the amount of multi-threaded computation (light green) that is occurring on the other threads while this MPI communication is taking place.
Dark gray Time inside an OpenMP region in which a core is idle or waiting to synchronize with the other OpenMP threads. In theory, during an OpenMP region all threads are active all of the time. In practice there are significant synchronization overheads involved in setting up parallel regions and synchronizing at barriers. These will be seen as dark gray holes in the otherwise good light green of optimal parallel computation. If you see these there may be an opportunity to improve performance with better loop scheduling or division of the work to be done.
Pale blue Thread synchronization time. Time spent waiting for synchronization between non-OpenMP threads (for example, a
pthread_join). Whether this time can be reduced depends on the purpose of the threads in question.
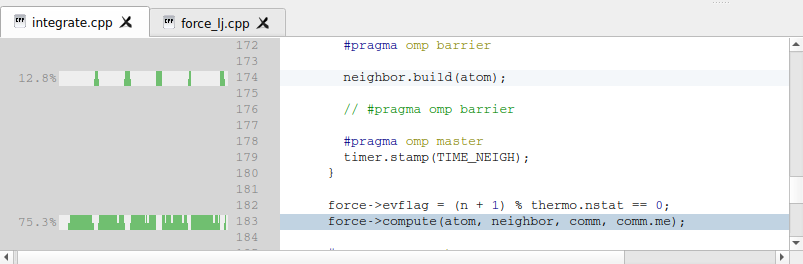
In the screenshot above you can see that 12.8% of the time is spent
calling neighbor.build(atom) and 75.3% of the time is spent calling
force->compute(atom, neighbor, comm, comm.me). The graphs show a
mixture of light green indicating an OpenMP region and dark
gray indicating OpenMP overhead. OpenMP overhead is the time spent in
OpenMP that is not the contents of an OpenMP region (user code).
Hovering the mouse over a line will show the exact percentage of time
spent in overhead, but visually you can already see that it is
significant but not dominant here.
Increasingly, programs use both MPI and OpenMP to parallelize their
workloads efficiently. Linaro MAP fully and transparently supports this model
of working. It is important to note that the graphs are a reflection of
the application activity over time:
A large section of blue in a mixed-mode MPI code means that all the processes in the program were inside MPI calls during this period. Try to reduce these, especially if they have a triangular shape suggesting that some processes were waiting inside MPI while others were still computing.
A large section of dark green means that all the processes were running single-threaded computations during that period. Avoid this in an MPI+OpenMP code, or you might as well leave out the OpenMP sections altogether.
Ideally you want to achieve large sections of light green, showing OpenMP regions being effectively used across all processes simultaneously.
It is possible to call MPI functions from within an OpenMP region. Linaro MAP only supports this if the OpenMP primary thread is the one that makes the MPI calls. In this case, the blue block of MPI time are smaller, demonstrating that one OpenMP thread is in an MPI function while the rest are doing something else, such as useful computation.