Examine GPU threads and data
When working with GPUs, most of the user interface is unchanged from regular MPI or multithreaded debugging. However, there are a number of enhancements and additional features that have been added to help you understand the state of GPU programs:
Select GPU threads
The Thread Selector enables you to select your current GPU thread. The current thread is used for the variable evaluation windows, along with the various GPU stepping operations.

The first entries represent the block index. The subsequent entries represent the 3D thread index inside that block.
Note
For Intel Xe the 3D thread index is based on the global work-item ID; the block index is not used (grayed-out).
Please note that the global work-item ID might be transposed due to an
optimization the Intel oneAPI runtime often performs, for example work-item ID
<<<10,20,30>>> might become <<30,20,10>>.
The offset parameter for global work-item IDs, which is deprecated since SYCL 2020, is not applied when displaying the 3D thread index.
Changing the current thread updates the local variables, the evaluations, and the current line displays and source code displays to reflect the change.
The Thread Selector is also updated to display the current GPU thread if it changes as a result of any other operation. For example, if:
You change threads by selecting an item in the Parallel Stack View.
A memory error is detected and is attributed to a particular thread.
The kernel has progressed, and the previously selected thread is no longer present in the device.
The Thread Selector also displays the dimensions of the grid and blocks in your program.
It is only possible to inspect/control threads in the set of blocks that are actually loaded in to the GPU. If you try to select a thread that is not currently loaded, a message is displayed.
Note
The Thread Selector is only displayed when there is a GPU kernel active.
View GPU thread locations
The Parallel Stack View displays the location and number of GPU threads.
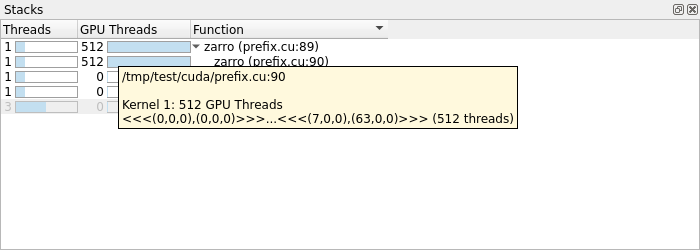
Click an item in the Parallel Stack View to select the appropriate GPU thread, update the variable display components accordingly, and move the Source Code viewer to the appropriate location.
Hovering over an item in the Parallel Stack View also enables you to see which individual GPU thread ranges are at a location, as well as the size of each range.
It is not possible to collect the stack trace for all threads in a timely manner. The stack traces are gathered by collecting one for each thread that has stopped in a unique location.
For more information about Intel Xe GPU and the Parallel Stack View, see Intel Xe GPU Thread Details.
Kernel Progress View
The Kernel Progress View displays at the bottom of the user interface by default when a kernel is in progress.
This view provides the necessary detail to help you decide whether array data is fresh or stale during debugging.
For a simple kernel that is to calculate an output value for each index in an array, it is not easy to check whether the value at position x in an array has been calculated, or whether the calculating thread has yet to be scheduled.
This contrasts sharply with scalar programming, where if the counter of a (up-)loop exceeds x then the value of index x can be taken as being the final value.
The Kernel Progress View identifies the kernels that are in progress. The number of kernels are identified and grouped by different kernel identifiers across processes. The identifier is the kernel name.
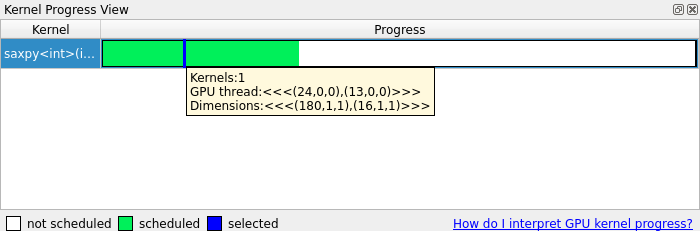
A colored progress bar shows which GPU threads are in progress. The progress bar is a projection onto a straight line of the GPU block and thread indexing system, which is potentially 6-dimensional. It illustrates the sizes of the kernels operating in the program.
Click the color-highlighted sections of the progress bar to select a thread that closely matches the click location. Blue represents the GPU thread that you selected.
Green GPU threads are threads which are scheduled to run. Multiple scheduled threads display in different shades of green to differentiate them.
White areas of the progress bar represent items which are inactive. They are inactive either because they have already run, or are not scheduled to run.
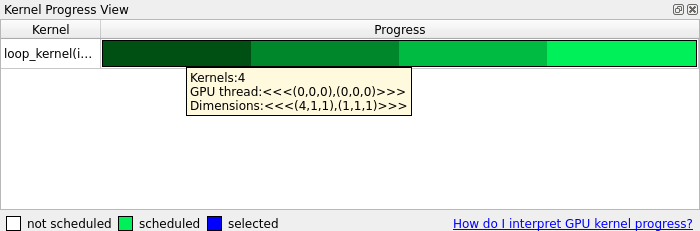
Kernels with the same name are stacked, and the shade of green becomes darker. If these kernels are different in size, then the maximum in each of the 6-dimensions is shown.
Kernels with different names display on separate rows.
Source Code viewer
The Source Code viewer helps you visualize the program flow through your source code by highlighting lines in the current stack trace. When debugging GPU kernels, it will color highlight lines with GPU threads present and display the GPU threads in a similar manner to that of regular CPU threads and processes. Hovering over a highlighted line in the Source Code viewer will display a summary of the GPU threads on that line. See Source code viewer.