Get started using Custom Metrics
Follow the instructions in this section to get started using custom metrics with Linaro MAP and Linaro Performance Reports.
About this task
The development of custom metrics for use with Linaro MAP requires you to read and understand:
the Documentation section which highlights the common pitfalls when writing custom metrics.
the Metric Definition File section which provides details about the meta information in custom1.xml that Linaro MAP requires to run and display the custom metrics.
the Metric Plugin Template section which describes the functions which need to be implemented by a custom metrics library.
In addition, see information on exposing custom metrics in Linaro Performance Reports in Linaro Performance Reports Integration.
Procedure
Open a terminal in the
/custom/examples/directory, which contains:a Makefile for building the custom metrics shared library.
the source for the example custom metric (custom1.c).
- report.xml, which explains to Linaro Performance Reports
how to access the custom metric.
- custom1.xml, which provides
metadata about this metric to Linaro MAP.
If a custom configuration directory for the Linaro Forge tool is in use, set the
ALLINEA_CONFIG_DIRenvironment variable to the path of the custom configuration directory.To build and install the custom metric library to the default location (or that specified by
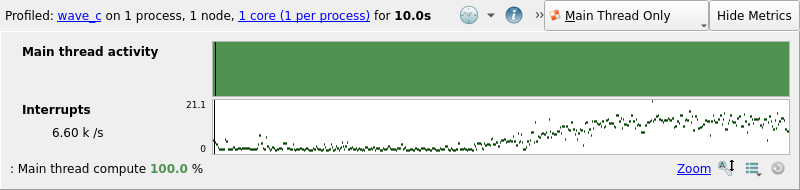
ALLINEA_CONFIG_DIR), runmakefollowed bymakeinstall.Begin profiling an application as normal with Linaro MAP. To display the custom metric upon completion of the run, use the Metrics menu (). Here is an example of how this looks:
In addition, the
.htmland the.txtreport files generated by Linaro Performance Reports have an extra section containing the custom metric data.