Current memory usage
Memory leaks can be a significant problem for software developers. If your program’s memory usage grows faster than expected, or continues to grow through its execution, it is possible that memory is being allocated which is not being freed when it is no longer required.
This type of problem is typically difficult to diagnose, and particularly so in a parallel environment.
At any point in your program, select to display the currently allocated memory in your program for the currently selected group. For larger process groups, the processes displayed will be the ones that are using the most memory across that process group.
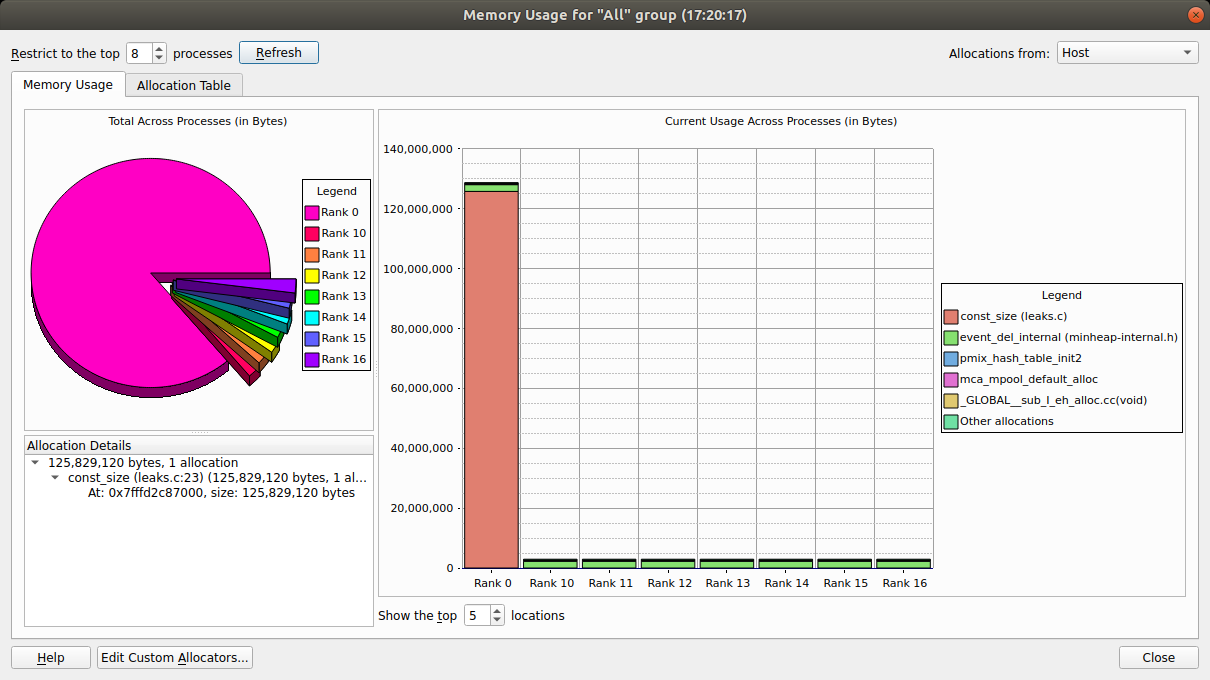
To view graphical representations of memory usage, select the Memory Usage tab.
The pie chart gives an at-a-glance comparison of the total memory allocated to each process. This gives an indication of the balance of memory allocations. Any one process taking an unusually large amount of memory is identifiable here.
The stacked bar chart on the right is where the most interesting information starts. Each process is represented by a bar, and each bar broken down into blocks of color that represent the total amount of memory allocated by a particular function in your code. Say your program contains a loop that allocates one hundred bytes that is never freed. That is not a lot of memory. But if that loop is executed ten million times, you are looking at a gigabyte of memory being leaked! There are six blocks in total. The first five represent the five functions that allocated the most memory allocated, and the 6th (at the top) represents the rest of the allocated memory, wherever it is from.
As you can see, large allocations show up as large blocks of color. If your program is close to the end, or these grow, they are severe memory leaks.
Typically, if the memory leak does not make it into the top five allocations under any circumstances then it may not be significant. If you are still concerned you can view the data in the table view yourself.
For more information about a block of color, click on the block. This displays detailed information about the memory allocations comprising it in the bottom-left pane. Scanning down this list gives you a good idea of what size allocations were made, how many, where from, and if the allocation resides in high bandwidth memory. If you double-click on any one of these the Pointer Details window will open, showing you exactly where that pointer was allocated in your code.
Note
Only a single stack frame will be displayed if Store stack backtraces for memory allocations on the Memory Debugging Options window is disabled.
To view the current memory usage in a tabular format, select the Allocation Table tab.
The table is split into five columns:
- Allocated by:
Code location of the stack frame or function allocating memory in your program.
- Count:
Number of allocations called directly from this location.
- Total Size:
Total size (in bytes) of allocations directly from this location.
- Count (including called functions):
Number of allocations from this location. This includes any allocations called indirectly, for example, by calling other functions.
- Total Size (including called functions):
Total size (in bytes) of allocations from this location, including indirect allocations.
For example, if func1 calls func2 which calls malloc to allocate 50 bytes. An
allocation of 50 bytes will be reported against func2 in the Total Size
column. A cumulative allocation of 50 bytes will also be recorded against both functions
func1 and func2 in the Total Size (including called functions) column.
Another valuable use of this feature is to play the program for a while, refresh the window, play it for a bit longer, refresh the window, and so on. If you pick the points at which to refresh, for example, after units of work are complete, you can watch as the memory load of the different processes in your job fluctuates and you will see any areas that continue to grow. These are problematic leaks.
Detect leaks when using custom allocators/memory wrappers
Some compilers wrap memory allocations inside many other functions. In this case you might find, for example, that all Fortran 90 allocations are inside the same routine. This can also happen if you have written your own wrapper for memory allocation functions.
In these circumstances you will see one large block in the Memory Usage tab. You can mark such functions as Custom Allocators to exclude them from the bar chart and table by right-clicking on the function and selecting Add Custom Allocator. Memory allocated by a custom allocator is recorded against its caller instead.
For example, if myfunc calls mymalloc and mymalloc is marked as a custom allocator,
the allocation will be recorded against myfunc instead. You can edit the list of custom
allocators by clicking Edit Custom Allocators at the bottom of the window.