Get started using Custom Metrics
Follow the instructions in this section to get started using custom metrics with Arm® MAP and Arm® Performance Reports.
About this task
The development of custom metrics for use with Arm® MAP requires you to read and understand:
- the Documentation section which highlights the common pitfalls when writing custom metrics.
- the Metric Definition File section which provides details about the meta information in custom1.xml that Arm® MAP requires to run and display the custom metrics.
- the Metric Plugin Template section which describes the functions which need to be implemented by a custom metrics library.
In addition, see information on exposing custom metrics in Arm® Performance Reports in Arm® Performance Reports Integration.
Procedure
Open a terminal in the
/custom/examples/directory, which contains:- a Makefile for building the custom metrics shared library.
- the source for the example custom metric (custom1.c).
- report.xml, which explains to Arm
- Performance Reports how to access the custom metric.
- custom1.xml, which provides
- metadata about this metric to Arm® MAP.
If a custom configuration directory for the Arm HPC tools is in use, set the
ALLINEA_CONFIG_DIRenvironment variable to the path of the custom configuration directory.To build and install the custom metric library to the default location (or that specified by
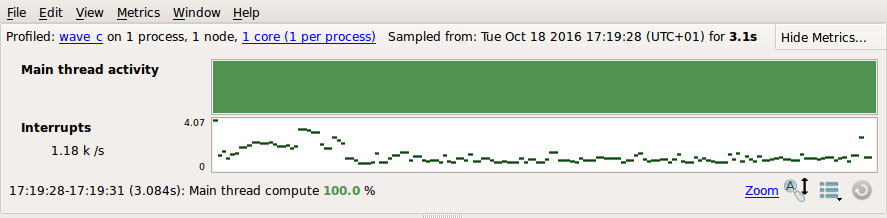
ALLINEA_CONFIG_DIR), runmakefollowed bymakeinstall.Begin profiling an application as normal with Arm® MAP. To display the custom metric upon completion of the run, use the Metrics menu (). Here is an example of how this looks:
In addition, the
.htmland the.txtreport files generated by Arm® Performance Reports have an extra section containing the custom metric data.