Overview
A short description of the main features of the Stacks view.
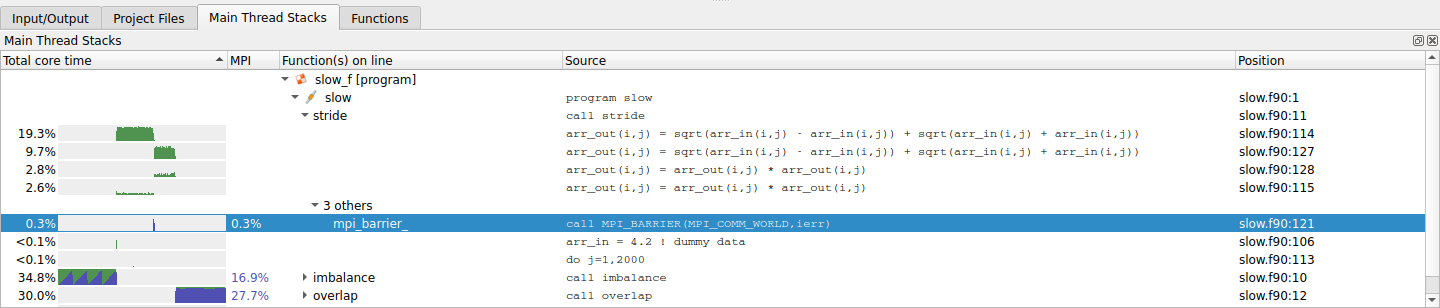
The Stacks view shows:
- The first line,
slow, represents the entire program run. - Nested below
slowis a call to thestridefunction. Almost all of this call was in single-threaded compute (dark green). - The
stridefunction spent most of that time on the linearr_out(i,j)=sqrt(...)atslow.f90, line 114. 19.3% of the entire run was spent executing this line of code. - The 0.3% MPI time inside
stridecomes from anMPI_Barrieron line 121. - The next major function called from program
slowis theoverlapfunction, shown at the bottom of this figure. A more detailed breakdown is described in Metrics view. This function ran for 30.0% of the total time, and almost all of this was in MPI calls.
When you click on any line of the Stacks view, the Source Code viewer jumps to that line of code. This makes it a very easy way to navigate and understand the performance of even complex codes.
The percentage MPI time gives an idea as to how well your program is scaling and shows the location of any communication bottlenecks. As discussed in Source code (MAP), a sawtooth pattern in the view represents imbalance between processes or cores.
In the figure above, the MPI_Send call inside the
overlap function has a sawtooth pattern. This means that some
processes took significantly longer to finish the call than others,
perhaps because they were waiting longer for their receiver to become
ready.
Stacks view shows which lines of code spend the most time running, computing, or waiting. As with most places in the user interface, you can hover over a line or chart for a more detailed breakdown.