GPU programs
In a program using NVIDIA CUDA or AMD ROCm, CPU time spent waiting for GPU kernels to complete is shown in Purple in the Source code viewer.

In this screenshot, a CPU was waiting for a GPU kernel to complete on the highlighted lines in the Source code viewer.
NVIDIA CUDA Kernel Analysis
When CUDA kernel analysis mode is enabled (see NVIDIA GPU profiling) Arm® MAP will also display data for lines inside CUDA kernels. These graphs show when GPU kernels were active, and for each kernel a breakdown of the different types of warp stalls that occurred on that line. The different types of warp stalls are listed in CUDA Kernel analysis. Refer to the tooltip or selected line display (NVIDIA GPU CUDA profiles) to get the exact breakdown, but in general:
- Purple Selected. Instructions on this line were being executed on the GPU.
- Dark Purple Not selected. This means warps on this line were ready to execute, but that there was no available SM to do the executing.
- Red (various shades) Memory operations. Warps on this line were stalled waiting for some memory dependency to be satisfied. Shade of red indicates the type of memory operation.
- Blue (various shades) Execution dependency. Warps on this line were stalled until some other action completes. Shade of blue indicates the type of execution dependency.
Note that warp stalls are only reported per-kernel, so it is not possible to obtain the times within a kernel invocation at which different categories of warp stalls occurred. As function calls in CUDA kernels are also automatically fully inlined it is not possible to see warp stalls for 'time spent inside function(s) on line' for GPU kernel code.
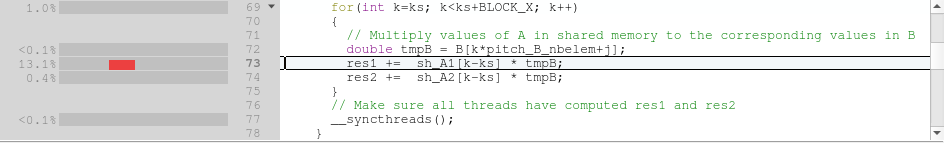
In this screenshot a CUDA kernel involving this line was running on this line 13.1% of the time, with most of the warps waiting for a memory access to complete. The colored horizontal range indicates when any kernel observed to be using this source line was on the GPU. The height of the colored region indicates the proportion of sampled warps that were observed to be on this line. See the NVIDIA CUPTI documentation at http://docs.nvidia.com/cuda/cupti/r_main.html#r_pc_sampling for more information on how warps are sampling.