Welcome page
Arm® MAP is a source-level profiler that can show how much
time was spent on each line of code. To see the source code in
Arm® MAP, compile your program with the debug flag. For
most compilers this is -g. Do not use a debug build, you
should always keep optimization flags turned on when profiling.
You can also use Arm® MAP on programs without debug information. In this case, inlined functions are not shown, and the source code cannot be shown but other features should work as expected.
To start Arm® MAP type one of the following shell commands into a terminal window:
map
map program_name [arguments]
map <profile-file>
Where <profile-file> is a profile file generated by a
Arm® MAP profiling run. It contains the program name and has a
'.map' extension.
Note
Please add the Arm® Forge installation path to the PATH environment variable to make the Arm® MAP available to the console:
export PATH=<Forge installation path>/bin:$PATH
Notes:
- When starting Arm® MAP to examine an existing profile file, a valid license is not needed.
- Unless you are using Express Launch mode (see Express Launch (MAP)), you should not attempt to pipe input directly to Arm® MAP. For information about how to achieve the effect of sending input to your program, see Program input and output.
We recommend that you add the --profile argument to
Arm® MAP. This runs without the interactive user interface and saves a
'.map' file to the current directory, so is ideal for profiling
jobs submitted to a queue.
When started in interactive mode, the Welcome page displays:
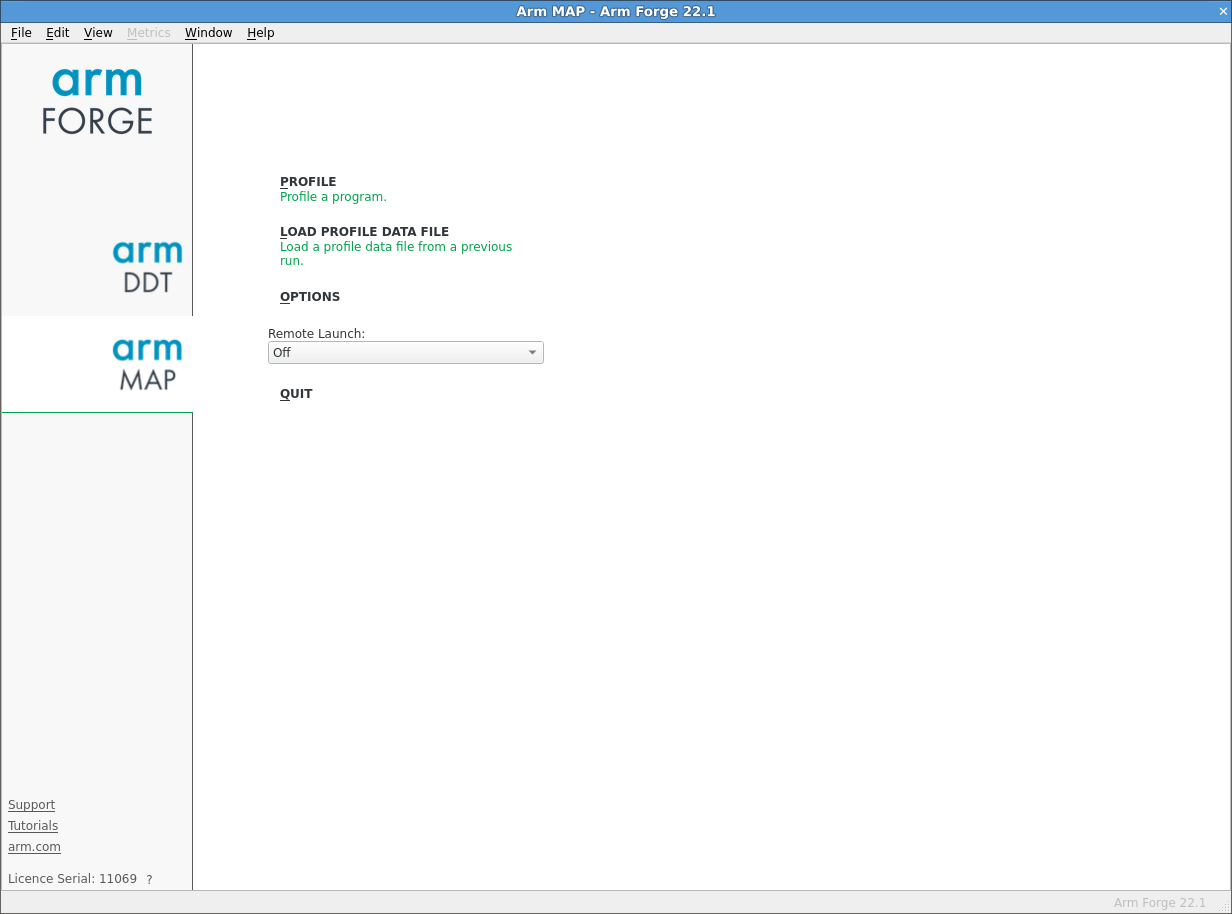
The Welcome page enables you to choose the kind of profiling you want to do, for example you can:
- Profile a program.
- Load a profile from a previous run.
- Connect to a remote system and accept a Reverse Connect request.
Note
In Express Launch mode (see Express Launch (MAP)) the Welcome page is not shown and you will be brought directly to the Run dialog instead. If no valid license is found, the program exits, and a message is shown in the console output.