Offline report HTML output
The output file contains four sections: Messages, Tracepoints, Memory Leak Report, and Output. At the end of a job, the four sections of the log output are merged (tracepoint data, error messages, memory leak data, and program output) into one file. If the process is terminated abruptly, for example by the job scheduler, these separate files will remain and the final single HTML report might not be created.
Note
The Memory Leak Report section is only created when memory debugging is enabled.
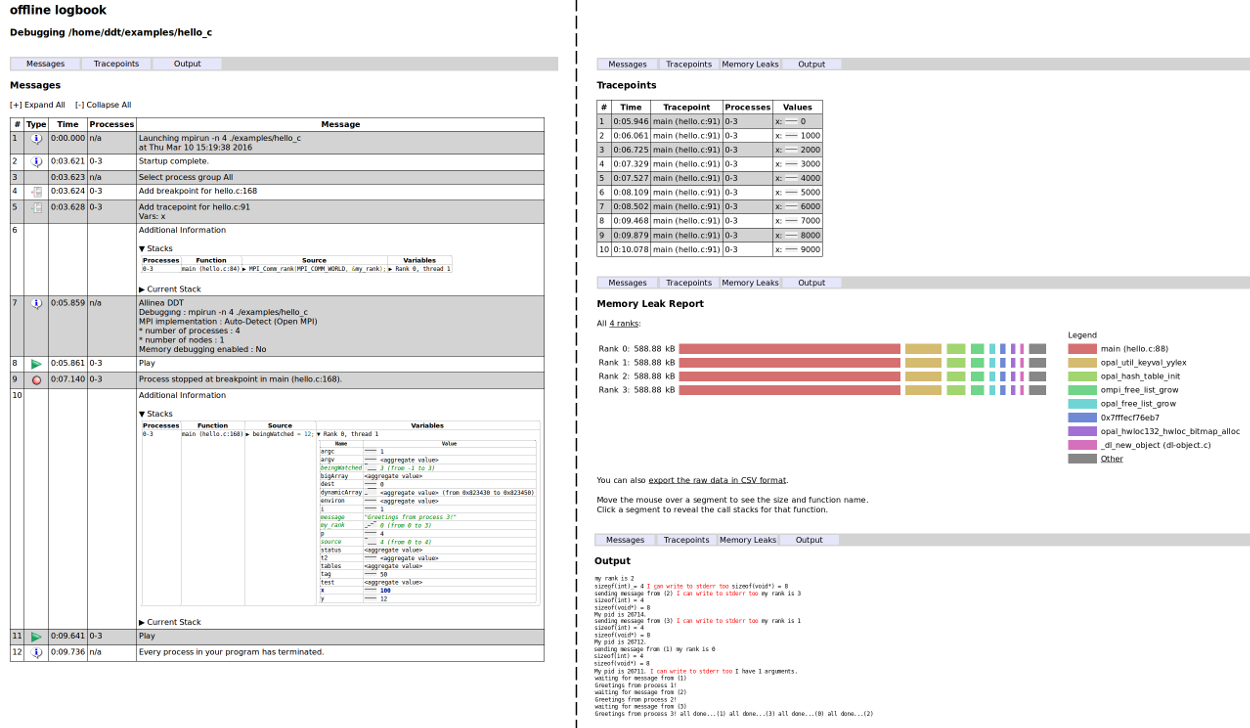
Timestamps are recorded with the contents in the offline log, and even though the file is neatly organized into four sections, it remains possible to identify ordering of events from the time stamp.
Messages
The Messages section contains the following:
- Error messages: for example if memory debugging detects an error, the message and the stack trace at the time of the error will be recorded from each offending process.
- Breakpoints: a message with the stopped processes and another one with the stacks, current stack and locals at this point.
- Additional information: after an error or a breakpoint has stopped
execution, an additional information message is recorded. This
message could contain the stacks, current stack, and local variables
for the stopped processes at this point of the execution.
- The Stacks table displays the parallel
stacks from all paused processes. Additionally, for every top-most
frame the variables (locals and arguments) will be displayed by
default. You can use the
–offline-framescommand-line option to display the variables for more frames or none. If–offline-frames=noneis specified no variables at all will be displayed, instead a Locals table will show the variables for the current process. Clicking on a function expands the code snippet and variables in one go. If the stop was caused by an error or crash, the stack of the responsible thread or process is listed first. - The Current Stacks table shows the stack of the current process.
- The Locals table (if
–offline-frames=none) and the Variables column of the Stacks table show the variables across the paused processes. The text highlighting scheme is the same as for the local variables in the user interface. The Locals table shows the local variables of the current process, whereas the Variables column shows the locals for a representative process that triggered the stop in that frame. In either case, a sparkline for each variable shows the distribution of values across the processes.
- The Stacks table displays the parallel
stacks from all paused processes. Additionally, for every top-most
frame the variables (locals and arguments) will be displayed by
default. You can use the
Tracepoints
The Tracepoints section contains the output from tracepoints, similar to that shown in the Tracepoints tab in an online debugging session. This includes sparklines displaying the variable distribution.
Memory Leak Report
The Memory Leak Report section displays a graphical representation of the largest memory allocations that were not freed by the end of the program.
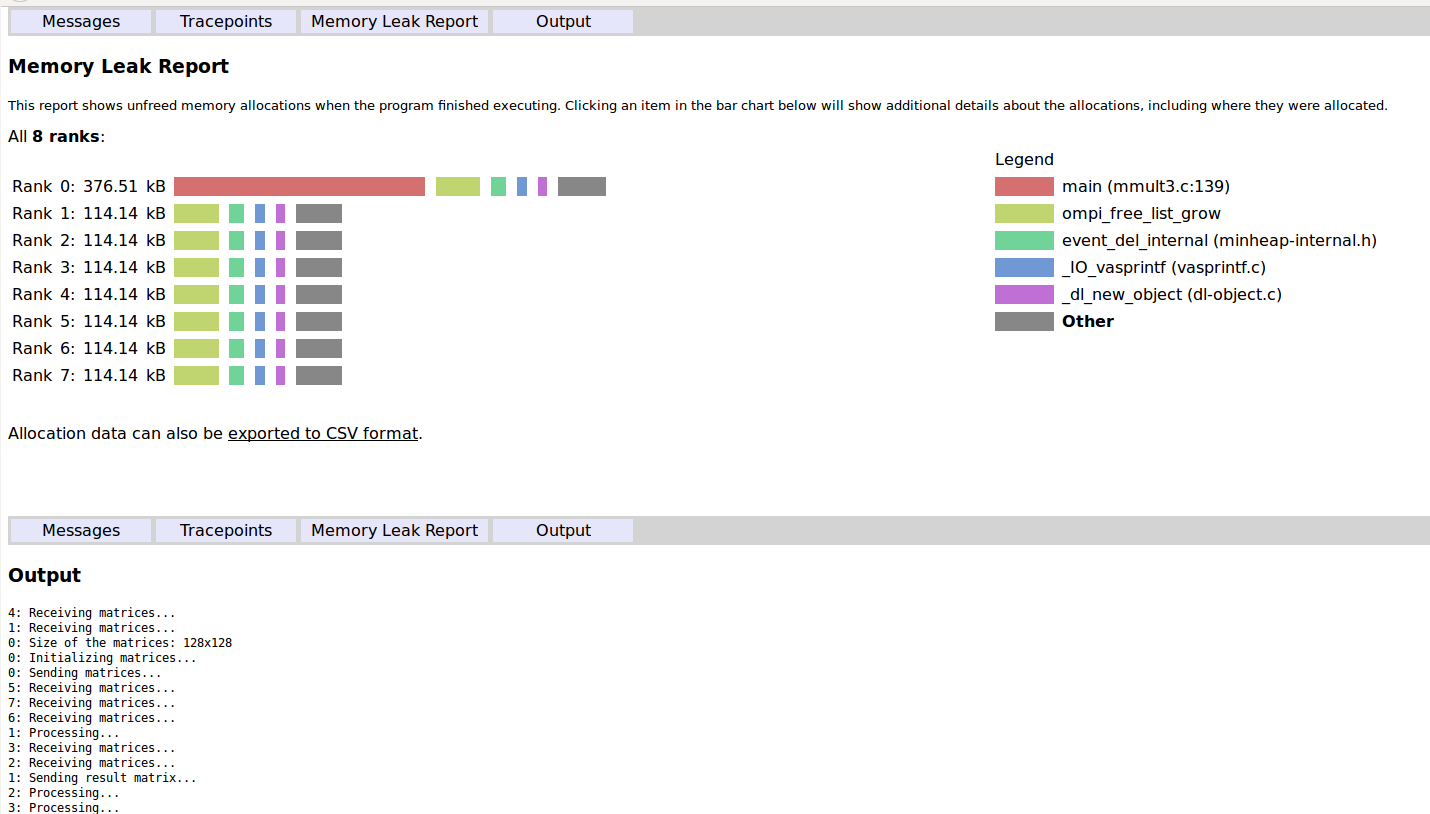
Each row corresponds to the memory still allocated at the end of a job
on a single rank. If multiple MPI ranks are being debugged, only those
with the largest number of memory allocations are shown. You can
configure the number of MPI ranks shown with –leak-report-top-ranks=X.
The memory allocations on each rank are grouped by the source location that allocated them. Each colored segment corresponds to one location, identified in the legend. Clicking on a segment reveals a table of all call paths leading to that location along with detailed information about the individual memory allocations:
By default all locations that contribute less than 1% of the total
allocations are grouped together into the Other item in the legend.
This limit can be configured by setting the
ALLINEA_LEAK_REPORT_MIN_SEGMENT environment variable to a percentage.
For example, ALLINEA_LEAK_REPORT_MIN_SEGMENT=0.5 will only group
locations with less than 0.5% of the total allocated bytes together.
In addition, only the eight largest locations are shown by default. This
can be configured with the –leak-report-top-locations=Y command-line
option.
The raw data can be exported to CSV format by clicking the export link.
Useful command line options:
| Option | Description |
|---|---|
–leak-report-top-ranks=X |
Limit the memory leak report to the top X ranks (default 8, implies –mem-debug) |
–leak-report-top-locations=Y |
Limit the memory leak report to the top Y locations in each rank (default 8, implies –mem-debug) |
–leak-report-top-call-paths=Z |
Limit the memory leak report to the top Z call paths to each allocating function (default 8, implies –mem-debug) |
Output
Output from the program is written to the Output section. For most MPIs this will not be identifiable to a particular process, but on those MPIs that do support it, which processes have generated the output will be reported.
Identical output from the Output and Tracepoints section is, if received in close proximity and order, merged in the output, where this is possible.